
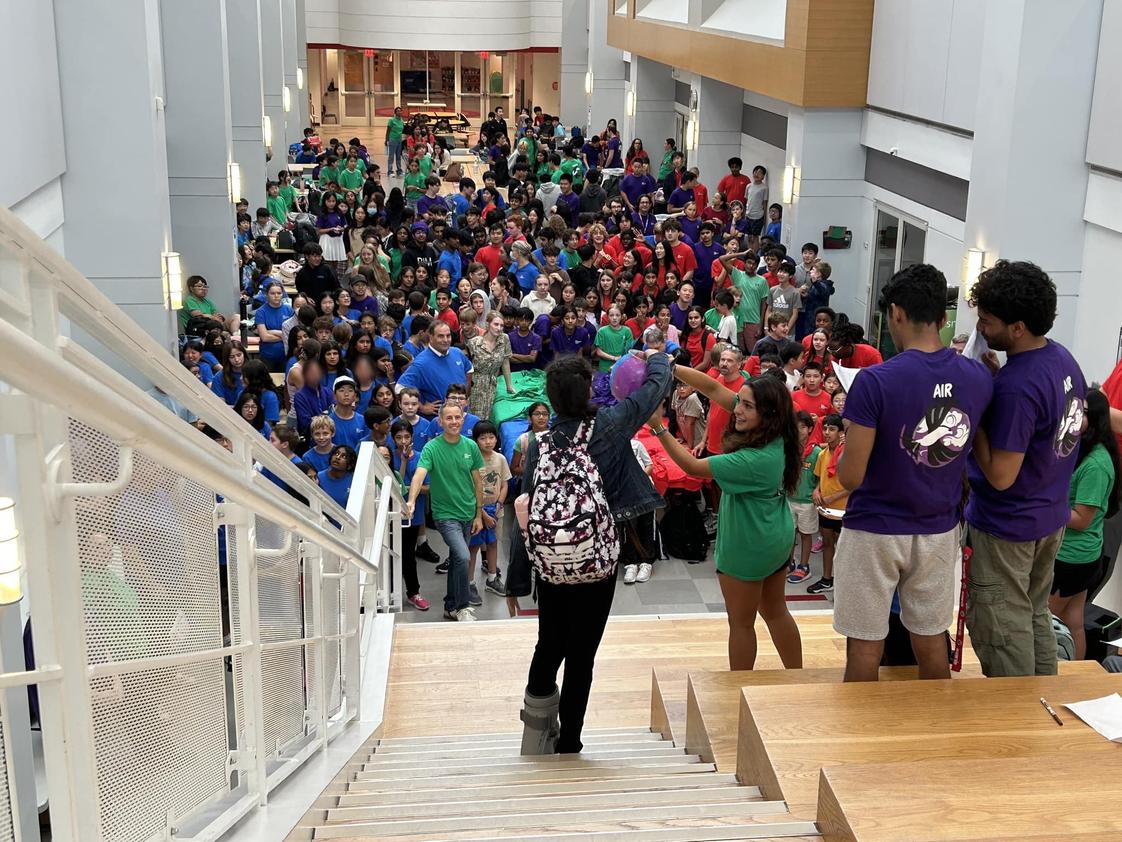
For the 2026 school year, there are 1,036 private schools serving 153,893 students in Virginia (there are 2,139 public schools, serving 1,257,026 students). 11% of all K-12 students in Virginia attend private schools (compared to the national average of 10%).
The average private school tuition is $15,491 for elementary schools and $18,697 for high schools (view national tuition averages).
The top-ranked private schools in Virginia include The Madeira School, BASIS Independent McLean, and Powhatan School.
The average acceptance rate is 80% (view national acceptance rates). Minority enrollment is 31% and the student-teacher ratio is 10:1.


Overview
This State (VA)
US
# Schools
1,036 Schools
Student Body:
# Students
153,893 Students
5,699,317 Students
% Average Students of Color
31%
34%
Student By Grade
Academics and Faculty:
# Teachers
14,685 Teachers
507,826 Teachers
Average Student-Teacher Ratio
10:1
11:1
% Average Faculty w/Advanced Degree
54%
55%
Average Class Size
14 students
15 students
Average Number of AP Courses
12 courses
13 courses
Average SAT score
1226
(Out of 1600)
1233
Average ACT score
27
(Out of 36)
26
Tuition and Acceptance Rate:
Average Yearly Tuition Cost
$17,320
$14,878
Average Summer Program Cost
$1,087
$1,138
Average % on Financial Aid
30%
35%
Average Financial Aid Grant
$8,819
$7,124
Average Acceptance Rate
80%
82%
Average Endowment Size
$45.97 million
$61.71 million
Students by Ethnicity:
Diversity Score
0.65
0.65
# American Indian Students
492 Students
29,886 Students
% American Indian Students
n/a
1%
# Asian Students
8,945 Students
265,088 Students
% Asian Students
6%
5%
# Hispanic Students
6,676 Students
507,413 Students
% Hispanic Students
5%
9%
# Black Students
11,979 Students
416,690 Students
% Black Students
8%
7%
# White Students
73,423 Students
2,932,713 Students
% White Students
49%
52%
# Hawaiian Students
370 Students
20,067 Students
% Hawaiian Students
n/a
n/a
# Two or more races Students
n/a
n/a
% of Two or more races Students
n/a
n/a
# Others Students
48,219 Students
1,471,571 Students
% of Others Students
32%
26%
All Ethnic Groups
Extracurriculars and Sports:
Average Number of Extracurriculars
10 extracurriculars
9 extracurriculars
Average Number of Sports
7 sports
7 sports
Top-Ranked Virginia Private Schools by County (2026)
County
# Schools
# Students
% of K-12 Students in Private Schools
Frequently Asked Questions
What are the top-ranked private schools in Virginia?
The top-ranked private schools in Virginia include The Madeira School, BASIS Independent McLean, and Powhatan School.
How many private schools are located in Virginia?
There are 1,036 private schools are located in Virginia.
How much do private schools cost in Virginia?
The average private school tuition in Virginia is $15,491 for elementary schools and $18,697 for high schools
How diverse are private schools in Virginia?
Approximately 31% of students in Virginia private schools are minority students (compared to the national percentage).
What percentage of students in Virginia go to private school?
11% of all K-12 students in Virginia attend private schools (compared to the national average of 10%).
What percentage of private schools are religiously affiliated in Virginia?
Which private schools in Virginia are often viewed compared to one another?
Popular comparisons of private schools in Virginia include: Rivermont School - Alleghany Highlands vs. Boys Home of Virginia, Gloucester Montessori School vs. Ware Academy, Love Covenant Christian School vs. Amelia Academy
Recent Articles

Executive Function Skills: The Key to Academic Success
Learn why executive function skills are among the strongest predictors of academic success and how parents and schools can strengthen them.

Private School Marketing Strategies for Enrollment Growth
Discover proven private school marketing strategies for 2026, including digital outreach, branding, enrollment management, and parent engagement.

Private School Transportation Options: A 2026 Parent Guide
Explore private school transportation options in 2026, including buses, carpools, transit, and safety considerations for families.


