Butte County Private Schools

For the 2026-27 school year, there are 12 private schools serving 1,270 students in Butte County, CA (there are 94 public schools, serving 29,714 public students). 4% of all K-12 students are educated in private schools (compared to the CA state average of 10%).
The average acceptance rate is 90%, which is higher than the California private school average acceptance rate of 84%.
92% of private schools in Butte County, CA are religiously affiliated (most commonly Seventh Day Adventist and Other).

Quick Facts (26-27)

  • # Private Schools: 12
  • # Students Served: 1,270
  • Average Tuition: $5,386
  • Student-Teacher Ratio: 17:1
  • Acceptance Rate: 90%
  • % Students on Financial Aid: 18%
  • Average Class Size: 15 students
  • % Students of Color: 19%
  • View Butte County, CA School Trends
  • Averages cover the schools that report each figure.
Quick Facts (26-27)

  • # Private Schools: 12
  • # Students Served: 1,270
  • Average Tuition: $5,386
  • Student-Teacher Ratio: 17:1
  • Acceptance Rate: 90%
  • % Students on Financial Aid: 18%
  • Average Class Size: 15 students
  • % Students of Color: 19%
  • View Butte County, CA School Trends
  • Averages cover the schools that report each figure.

Top Ranked Butte County Private Schools (2026-27)

Upward International Schools, Pines Academy Campus Photo
Gr: K-12 | 38 students
Avg. class size: 10 students
Baptist
14098 Skyway
Magalia, CA 95954
(530) 873-9448
Map of Chico Christian School
Gr: NS-8 | 418 students
Sports: 7
2801 Notre Dame Blvd
Chico, CA 95928
(530) 879-8989
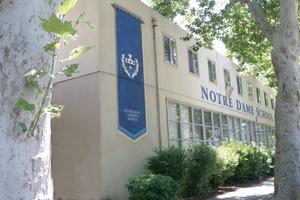
Notre Dame School Photo
Gr: PK-8 | 196 students
Avg. class size: 20 students
Sports: 3 | Extracurriculars: 8
Catholic
435 Hazel Street
Chico, CA 95928
(530) 342-2502
(2)
Map of Paradise Adventist Academy
Gr: 9-12
Avg. class size: 12 students
Sports: 5 | Extracurriculars: 3
Seventh Day Adventist
5699 Academy Dr.
Paradise, CA 95969
(530) 877-6540
Map of St. Thomas The Apostle Catholic School
Gr: K-8 | 138 students
Avg. class size: 20 students
Catholic
1380 Bird St
Oroville, CA 95965
(530) 534-6969
Map of Chico Montessori Children's House
Gr: K-1 | 75 students
Montessori School
814 Glenn St
Chico, CA 95928
(530) 342-5518
Map of Chico Oaks Adventist School
Gr: K-8 | 98 students
Seventh Day Adventist
1859 Hooker Oak Ave
Chico, CA 95926
(530) 342-5043
Map of Feather River Adventist School
Gr: K-7 | 30 students
Seventh Day Adventist
27 Cox Ln
Oroville, CA 95965
(153) 053-3884
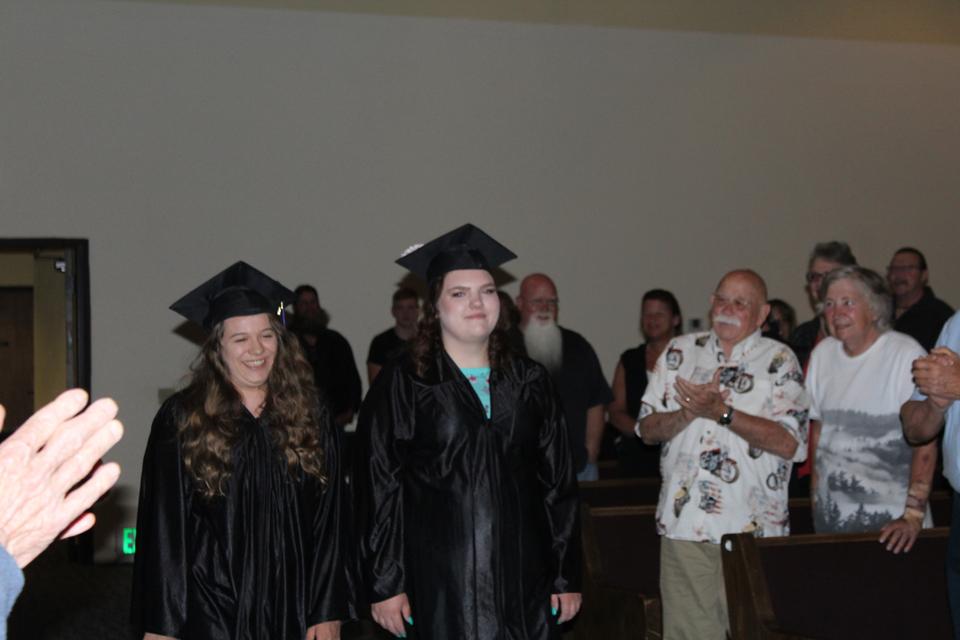
Hope Academy Chico Photo
Gr: K-8 | 39 students
Extracurriculars: 8
Christian
2869 Cohasset Road
Chico, CA 95973
(530) 518-4092
Map of Maranatha Christian School
Gr: 1-10 | 12 students
Mennonite
75 Los Verjeles
Bangor, CA 95914
(530) 679-0411
Oroville Christian School Photo
Gr: PK-8 | 180 students
Avg. class size: 15 students
Sports: 4 | Extracurriculars: 3
3785 Olive Highway
Oroville, CA 95966
(530) 533-2888
Map of Pleasant Valley Baptist School
Gr: PK-12 | 46 students
Baptist
13539 Garner Ln
Chico, CA 95973
(530) 343-0555
(1)
[+] Show Closed Private Schools in Butte County, California

Butte County Private Schools (Closed)

Map of Magalia Adventist School
Gr: 5-8 | 6 students
Seventh Day Adventist
15204 Skyway Rd
Magalia, CA 95954
(530) 873-9168
Map of Paradise Christian School
Gr: K-8 | 70 students
Baptist
5850 Clark Road
Paradise, CA 95969
(530) 877-2315
Map of The Progressive Schoolhouse
Gr: NS | 29 students
Alternative School
2400 Notre Dame Blvd
Chico, CA 95928
(530) 345-5665
Map of Rose Scott Learning Community
Gr: 1-11 | 19 students
Alternative School
850 Palmetto Ave
Chico, CA 95926
(530) 354-3101
Map of St. Thomas More Elementary School
Gr: PK-8 | 89 students
Catholic
771 Elliott Rd
Paradise, CA 95969
(530) 877-5328

Overview

Category
This State (CA)
US
# Schools
12 Schools

Showing 2016–2025.

The number of private schools in Butte County fell from 18 in 2016 to 12 in 2025.
# Students
1,270 Students
652,303 Students

Showing 2016–2025.

Average private school enrollment per school in Butte County rose from 85 students in 2016 to 115 in 2025.
% Average Students of Color
19%
52%

Showing 2016–2025.

Academics and Faculty:

# Teachers
82 Teachers
55,827 Teachers
Average Student-Teacher Ratio
17:1
12:1

Showing 2016–2025.

% Average Faculty w/Advanced Degree
31%
60%
Average Class Size
15 students
17 students
Average SAT score
1240
(Out of 1600)
1267
Average ACT score
24
(Out of 36)
28

Tuition and Acceptance Rate:

Average Yearly Tuition Cost
$5,386
$18,535
Average Summer Program Cost
$150
$1,075
Average % on Financial Aid
18%
30%
Average Financial Aid Grant
$1,817
$9,660
Average Acceptance Rate
90%
84%

Students by Ethnicity:

0.60
0.74

Showing 2016–2025.

# American Indian Students
7 Students
3,574 Students
% American Indian Students
<1%
1%
# Asian Students
57 Students
71,776 Students
% Asian Students
4%
11%

Showing 2016–2025.

# Hispanic Students
182 Students
104,400 Students
% Hispanic Students
13%
16%

Showing 2016–2025.

# Black Students
21 Students
30,215 Students
% Black Students
1%
5%

Showing 2016–2025.

# White Students
841 Students
235,682 Students
% White Students
58%
37%

Showing 2016–2025.

# Hawaiian Students
11 Students
5,499 Students
% Hawaiian Students
1%
1%
# Others Students
337 Students
181,409 Students
% of Others Students
23%
29%

Showing 2016–2025.

All Ethnic Groups

Extracurriculars and Sports:

Average Number of Extracurriculars
6 extracurriculars
9 extracurriculars
Average Number of Sports
5 sports
7 sports

Frequently Asked Questions

What are the top ranked private schools in Butte County, CA?
The top ranked private schools in Butte County, CA include Notre Dame School, Paradise Adventist Academy, and St. Thomas The Apostle Catholic School.
How many private schools are located in Butte County?
12 private schools are located in Butte County.
How diverse are private schools in Butte County?
Butte County private schools are approximately 19% minority students, which is lower than the California private school average of 52%.
What percentage of students in Butte County go to private school?
4% of all K-12 students in Butte County are educated in private schools (compared to the CA state average of 10%).
What percentage of private schools are religiously affiliated in Butte County?
92% of private schools in Butte County are religiously affiliated (most commonly Seventh Day Adventist and Other).
Which private schools in Butte County are often viewed compared to one another?

Recent Articles

When Your Child Is Excluded From Private School Events
Learn how to support your child when excluded from private school birthday parties and social events, recognize bullying, communicate with teachers, encourage friendships, and address repeated exclusion with confidence.
Private School Scholarship Renewal Requirements
Learn what students must do to keep private school scholarships, including academic performance, attendance, conduct, extracurricular commitments, renewal deadlines, and how parents can protect tuition assistance throughout their education.
Private School Deposits: What If You Change Schools?
Learn what happens to your private school enrollment deposit when your child accepts another offer, including refund policies, contract obligations, withdrawal deadlines, and practical steps to minimize financial losses.

Filter Schools

School Level
Must Offer Grade
Show more
Gender
School Focus
Religious Affiliation
ADD/ADHD Support
Summer Program

Quick Links