Richmond County Private Schools

For the 2026-27 school year, there are 2 private schools serving 273 students in Richmond County, VA (there are 6 public schools, serving 1,374 public students). 17% of all K-12 students are educated in private schools (compared to the VA state average of 11%).
The average acceptance rate is 90%, which is higher than the Virginia private school average acceptance rate of 82%.
67% of private schools in Richmond County, VA are religiously affiliated (most commonly Baptist and Catholic).

Quick Facts (26-27)

Quick Facts (26-27)

Top Ranked Richmond County Private Schools (2026-27)

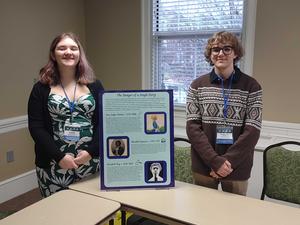
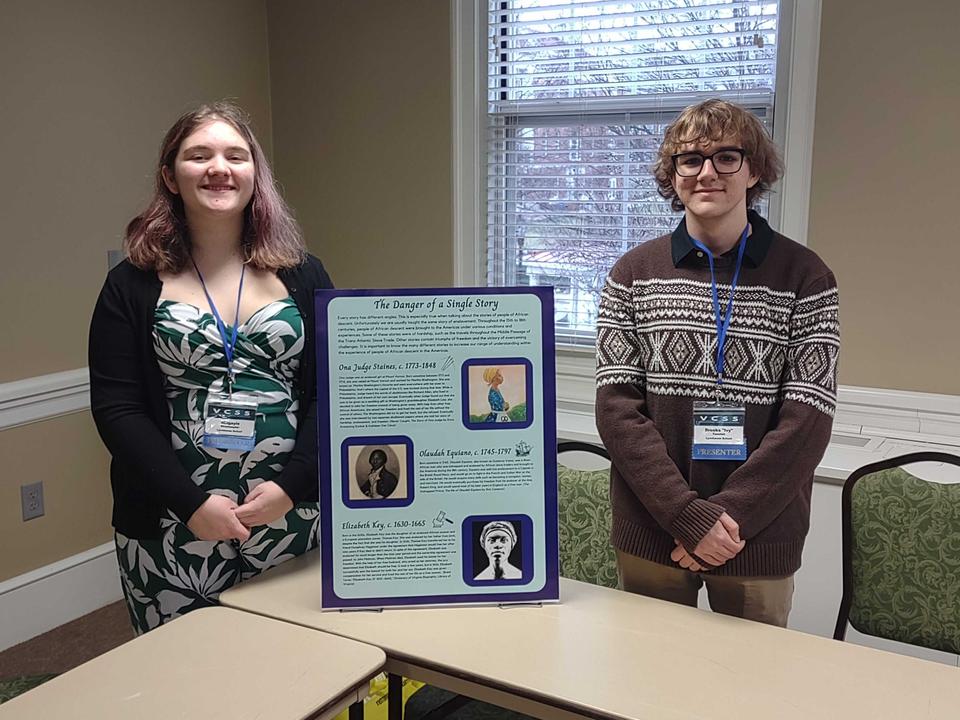
Lynnhaven School Photo
Gr: 8-12 | 50 students
Avg. class size: 8 students
Sports: 5 | Extracurriculars: 7
Specialized Curriculum
8151 Warriner Rd
Richmond, VA 23231
(804) 750-2300
(2)
Map of Community Christian Academy
Gr: 1-12 | 21 students
Alternative School (Baptist)
7521 Comanche Dr
Richmond, VA 23225
(804) 233-3113

Overview

Category
This State (VA)
US
# Schools
3 Schools
# Students
273 Students
152,623 Students
% Average Students of Color
88%
31%

Academics and Faculty:

# Teachers
28 Teachers
14,415 Teachers
Average Student-Teacher Ratio
10:1
11:1
% Average Faculty w/Advanced Degree
100%
55%
Average Class Size
8 students
14 students
Average Number of AP Courses
8 courses
12 courses
Average SAT score
1350
(Out of 1600)
1229
Average ACT score
25
(Out of 36)
27

Tuition and Acceptance Rate:

Average Yearly Tuition Cost
$24,500
$15,965
Average % on Financial Aid
50%
30%
Average Financial Aid Grant
$7,500
$9,451
Average Acceptance Rate
90%
82%

Students by Ethnicity:

0.59
0.65
# American Indian Students
0 Students
492 Students
% American Indian Students
0%
<1%
# Asian Students
0 Students
8,941 Students
% Asian Students
0%
6%
# Hispanic Students
79 Students
6,674 Students
% Hispanic Students
36%
5%
# Black Students
119 Students
11,974 Students
% Black Students
53%
8%
# White Students
3 Students
73,416 Students
% White Students
1%
49%
# Hawaiian Students
0 Students
370 Students
% Hawaiian Students
0%
<1%
# Others Students
22 Students
47,699 Students
% of Others Students
10%
32%
All Ethnic Groups

Extracurriculars and Sports:

Average Number of Extracurriculars
7 extracurriculars
10 extracurriculars
Average Number of Sports
5 sports
7 sports

Frequently Asked Questions

What are the top ranked private schools in Richmond County, VA?
The top ranked private schools in Richmond County, VA is Lynnhaven School.
How many private schools are located in Richmond County?
2 private schools are located in Richmond County.
What percentage of students in Richmond County go to private school?
17% of all K-12 students in Richmond County are educated in private schools (compared to the VA state average of 11%).
What percentage of private schools are religiously affiliated in Richmond County?
67% of private schools in Richmond County are religiously affiliated (most commonly Baptist and Catholic).

Recent Articles

When a Private School Changes Head of School
A private school leadership change can raise important questions. Learn how to evaluate head of school transitions, identify warning signs, and protect your child's educational experience before enrolling confidently.
Private School Financial Aid Renewal: Could Awards Shrink?
Could your private school financial aid shrink next year? Learn why awards change, how income and school budgets affect renewal, and what parents can do to protect affordability long-term.
Need-Blind vs. Need-Aware Private School Admissions
Understand how need-blind and need-aware private school admissions affect acceptance decisions, financial aid eligibility, and affordability, with practical guidance to help parents compare schools, ask questions, and plan confidently ahead.

Filter Schools

School Level
Must Offer Grade
Show more
Gender
School Focus
Religious Affiliation
ADD/ADHD Support
Summer Program

Quick Links