Dorchester County Private Schools

For the 2026-27 school year, there are 11 private schools serving 2,382 students in Dorchester County, SC (there are 35 public schools, serving 30,418 public students). 7% of all K-12 students are educated in private schools (compared to the SC state average of 8%).
The average acceptance rate is 88%, which is lower than the South Carolina private school average acceptance rate of 90%.
73% of private schools in Dorchester County, SC are religiously affiliated (most commonly Christian and Methodist).

Quick Facts (26-27)

Quick Facts (26-27)

Top Ranked Dorchester County Private Schools (2026-27)

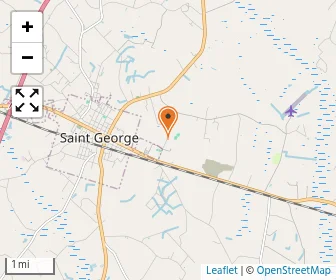
Map of Dorchester Academy
Gr: PK-12 | 374 students
Christian
234 Academy Rd
Saint George, SC 29477
(843) 563-9511
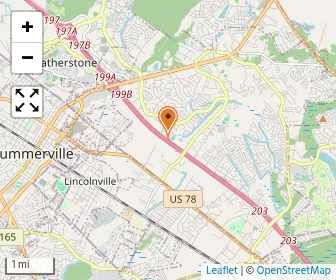
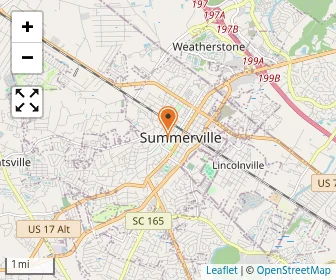
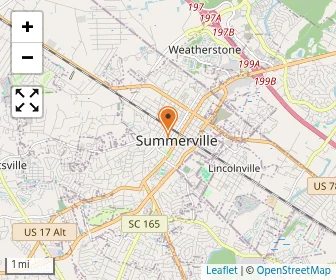
Map of Faith Christian School & Daycare
Gr: PK-12 | 311 students
Assembly of God
337 Farmington Rd
Summerville, SC 29483
(843) 873-8464
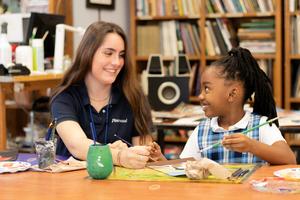
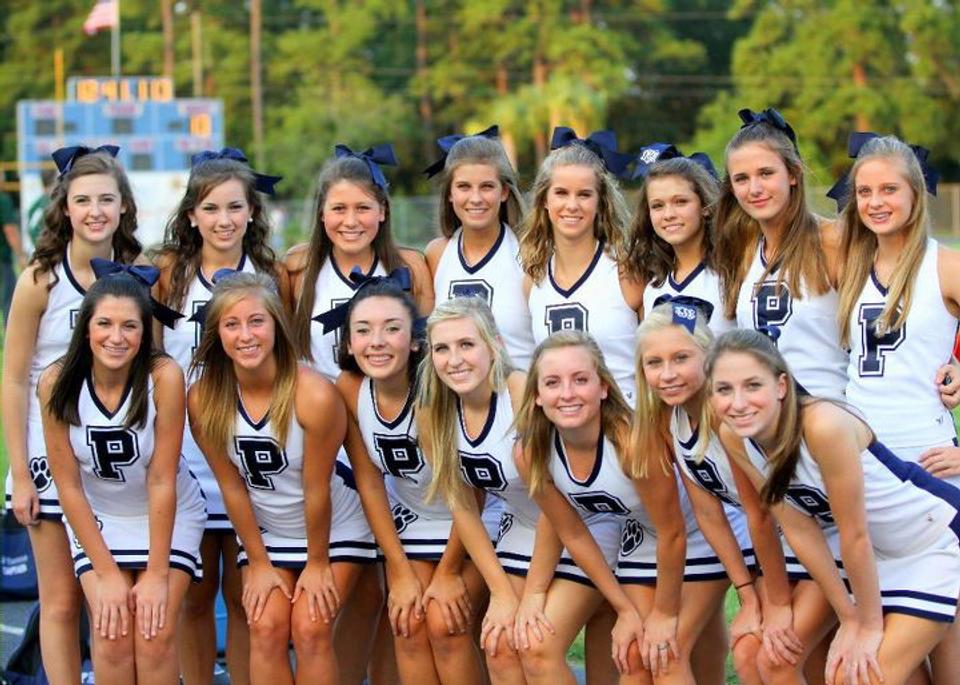
Pinewood Preparatory School Photo
Gr: PK-12 | 661 students
Avg. class size: 15 students
Sports: 14 | Extracurriculars: 27
1114 Orangeburg Road
Summerville, SC 29483
(843) 873-1643
(7)
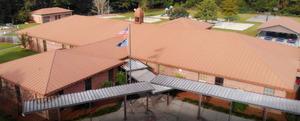
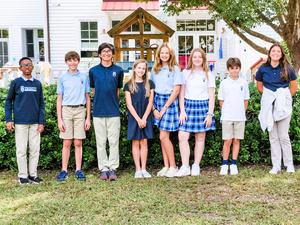
Summerville Catholic School Photo
Gr: PK-8 | 264 students
Avg. class size: 16 students
Sports: 6 | Extracurriculars: 3
Catholic
226 Black Oak Blvd
Summerville, SC 29485
(843) 873-9310
(1)
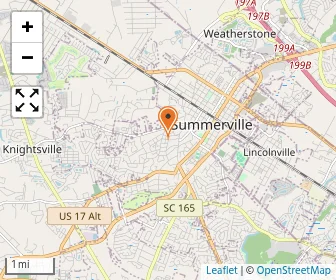
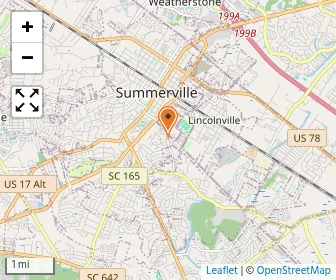
Map of Bethany Child Development Center
Gr: PK-K | 159 students
Daycare / Preschool (Methodist)
118 W 3rd South St
Summerville, SC 29483
(843) 821-1946
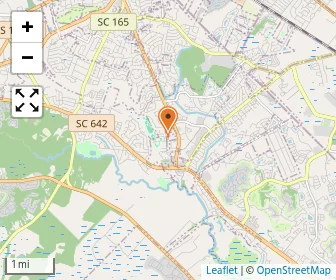
Map of New Alpha Christian School
Gr: PK-7 | 47 students
Christian
100 Waring St
Summerville, SC 29483
(843) 225-0203
Map of North Charleston KinderCare
Gr: NS-PK
Daycare / Preschool
8730 Dorchester Rd
North Charleston, SC 29420
(843) 552-0123
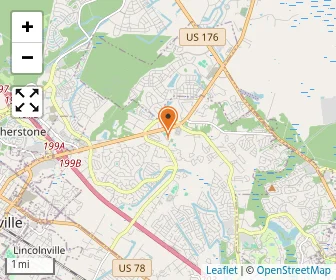
Map of Oakbrook Child Development Center
Gr: NS-PK | 151 students
Daycare / Preschool
901 Travelers Blvd
Summerville, SC 29485
(843) 871-3053
Map of Ridge Christian Academy
Gr: PK-12 | 156 students
Baptist
2168 Ridge Church Rd
Summerville, SC 29483
(843) 873-9856
(1)
Map of St. Lukes Children's Center
Gr: PK-K | 124 students
Daycare / Preschool (Evangelical Lutheran Church in America (formerly AELC, ALC, or LCA))
206 Central Avenue
Summerville, SC 29483
(843) 871-6666
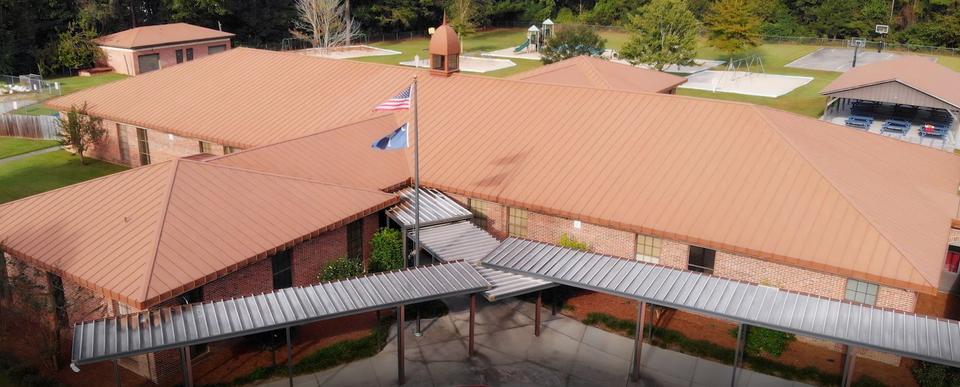
Trinity Classical Academy Photo
Gr: K-8 | 135 students
Avg. class size: 15 students
Extracurriculars: 6
Christian
111 Waring Street
Summerville, SC 29483
(843) 885-1081
(2)
[+] Show Closed Private Schools in Dorchester County, South Carolina

Dorchester County Private Schools (Closed)

Map of Charis Academy
Gr: 4-8 | 5 students
Special Education School
255 Stallsville Loop
Summerville, SC 29485
(843) 934-7520
Map of The Oaks Christian School
Gr: PK-8 | 175 students
Baptist
505 Gahagan Rd
Summerville, SC 29485
(843) 875-7667

Overview

Category
This State (SC)
US
# Schools
11 Schools

Showing 2016–2025. Full 11-year historical data available below ↓

Private schools down 3 in Dorchester County, falling from 14 in 2020 to 11 in 2025.
# Students
2,382 Students
72,685 Students

Showing 2016–2025. Full 11-year historical data available below ↓

Average size up 13 students in Dorchester County private schools, rising from 225 in 2024 to 238 in 2025.
% Average Students of Color
22%
19%

Showing 2016–2025. Full 11-year historical data available below ↓

Students of color down 2 points in Dorchester County private schools, from 24% in 2024 to 22% in 2025, while South Carolina stayed at 18%.

Academics and Faculty:

# Teachers
182 Teachers
6,625 Teachers
Average Student-Teacher Ratio
12:1
11:1

Showing 2016–2025. Full 11-year historical data available below ↓

Ratio higher in 2024 county private schools rose from 11:1 in 2023 to 13:1 in 2024, while state and national ratios stayed at 11:1.
% Average Faculty w/Advanced Degree
38%
50%
Average Class Size
15 students
14 students
Average Number of AP Courses
17 courses
11 courses

Tuition and Acceptance Rate:

Average Yearly Tuition Cost
$8,044
$9,690
Average % on Financial Aid
33%
29%
Average Financial Aid Grant
$1,875
$3,592
Average Acceptance Rate
88%
90%

Students by Ethnicity:

0.60
0.57

Showing 2016–2025. Full 11-year historical data available below ↓

Diversity score up 7 points in Dorchester County private schools, rising from 0.53 in 2016 to 0.60 in 2025.
# American Indian Students
7 Students
198 Students
% American Indian Students
<1%
<1%
# Asian Students
35 Students
1,169 Students
% Asian Students
2%
2%

Showing 2016–2025. Full 11-year historical data available below ↓

Asian enrollment held at 2% in Dorchester County private schools in 2025, while South Carolina stayed at 2% and the U.S. at 5%.
# Hispanic Students
86 Students
2,040 Students
% Hispanic Students
4%
3%

Showing 2016–2025. Full 11-year historical data available below ↓

Hispanic share up 1 point in Dorchester County private schools, rising from 3% in 2016 to 4% in 2025.
# Black Students
129 Students
3,565 Students
% Black Students
5%
5%

Showing 2016–2025. Full 11-year historical data available below ↓

Black student share held at 5% in Dorchester County private schools in 2016 and 2025, while the U.S. was 7% in both years.
# White Students
1,209 Students
40,420 Students
% White Students
51%
56%

Showing 2016–2025. Full 11-year historical data available below ↓

White share down 12 points in Dorchester County private schools, from 63% in 2016 to 51% in 2025.
# Hawaiian Students
5 Students
34 Students
% Hawaiian Students
<1%
<1%
# Others Students
911 Students
24,055 Students
% of Others Students
38%
34%

Showing 2016–2025. Full 11-year historical data available below ↓

Other-race share up 10 points in Dorchester County private schools, rising from 28% in 2016 to 38% in 2025.
All Ethnic Groups

Extracurriculars and Sports:

Average Number of Extracurriculars
12 extracurriculars
8 extracurriculars
Average Number of Sports
10 sports
8 sports

Frequently Asked Questions

What are the top ranked private schools in Dorchester County, SC?
The top ranked private schools in Dorchester County, SC include Pinewood Preparatory School, Dorchester Academy, and Faith Christian School & Daycare.
How many private schools are located in Dorchester County?
11 private schools are located in Dorchester County.
How diverse are private schools in Dorchester County?
Dorchester County private schools are approximately 22% minority students, which is higher than the South Carolina private school average of 19%.
What percentage of students in Dorchester County go to private school?
7% of all K-12 students in Dorchester County are educated in private schools (compared to the SC state average of 8%).
What percentage of private schools are religiously affiliated in Dorchester County?
73% of private schools in Dorchester County are religiously affiliated (most commonly Christian and Methodist).
Which private schools in Dorchester County are often viewed compared to one another?
Popular comparisons of private schools in Dorchester County include: St. Lukes Children's Center vs. Pinewood Preparatory School

Recent Articles

When a Private School Changes Head of School
A private school leadership change can raise important questions. Learn how to evaluate head of school transitions, identify warning signs, and protect your child's educational experience before enrolling confidently.
Private School Financial Aid Renewal: Could Awards Shrink?
Could your private school financial aid shrink next year? Learn why awards change, how income and school budgets affect renewal, and what parents can do to protect affordability long-term.
Need-Blind vs. Need-Aware Private School Admissions
Understand how need-blind and need-aware private school admissions affect acceptance decisions, financial aid eligibility, and affordability, with practical guidance to help parents compare schools, ask questions, and plan confidently ahead.

Filter Schools

School Level
Must Offer Grade
Show more
Gender
School Focus
Religious Affiliation
ADD/ADHD Support
Summer Program

Quick Links