Richland County Private Elementary Schools

For the 2026-27 school year, there are 9 private elementary schools serving 1,688 students in Richland County, OH.
The average acceptance rate is 77%, which is lower than the Ohio private elementary school average acceptance rate of 87%.
80% of private elementary schools in Richland County, OH are religiously affiliated (most commonly Catholic and Christian).

Quick Facts (26-27)

  • # Private Schools: 9
  • # Students Served: 1,688
  • Average Tuition: $6,200
  • % Students on Financial Aid: 78%
  • Acceptance Rate: 77%
  • Average Class Size: 15 students
  • % Students of Color: 15%
  • View Richland County, OH School Trends
Quick Facts (26-27)

  • # Private Schools: 9
  • # Students Served: 1,688
  • Average Tuition: $6,200
  • % Students on Financial Aid: 78%
  • Acceptance Rate: 77%
  • Average Class Size: 15 students
  • % Students of Color: 15%
  • View Richland County, OH School Trends
Top Ranked Richland County Private Elementary Schools (2026-27)

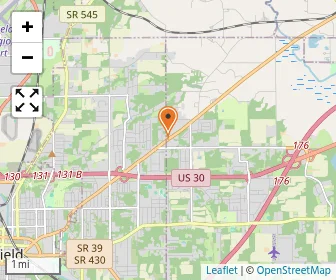
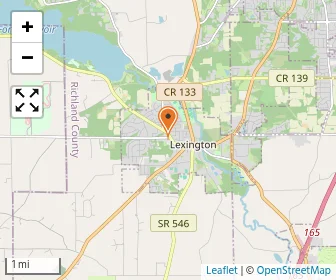
Map of -- Mansfield Christian School-
Gr: NS-12 | 863 students
Avg. class size: 18 students
Sports: 8
Christian
500 Logan Rd
Mansfield, OH 44907
(419) 756-5651
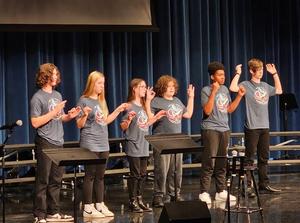
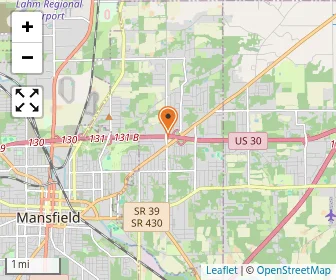
Discovery School Photo
Gr: PK-6 | 141 students
Avg. class size: 16 students
Sports: 2 | Extracurriculars: 7
Alternative School
855 Millsboro Road
Mansfield, OH 44903
(419) 756-8880
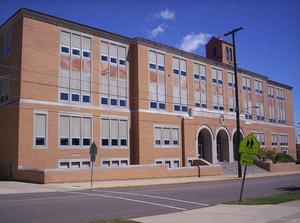
Mansfield Sda School Photo
Gr: K-8
Seventh Day Adventist
1040 W Cook Rd
Mansfield, OH 44906
(419) 756-9947
(1)
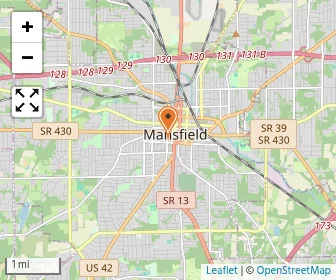
Map of St. Mary Catholic School
Gr: PK-8 | 89 students
Catholic
1630 Ashland Rd
Mansfield, OH 44905
(419) 589-2114
(1)
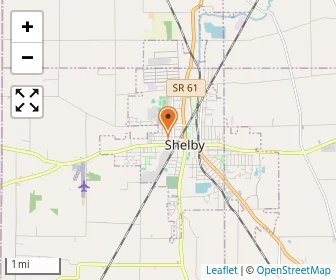
Map of St. Mary School
Gr: PK-6 | 71 students
Avg. class size: 15 students
Sports: 1
Catholic
26 West St
Shelby, OH 44875
(419) 342-2626
Map of St. Peter's Elementary School
Gr: PK-6 | 125 students
Avg. class size: 16 students
Sports: 3 | Extracurriculars: 5
Catholic
63 S Mulberry St
Mansfield, OH 44902
(419) 524-2572
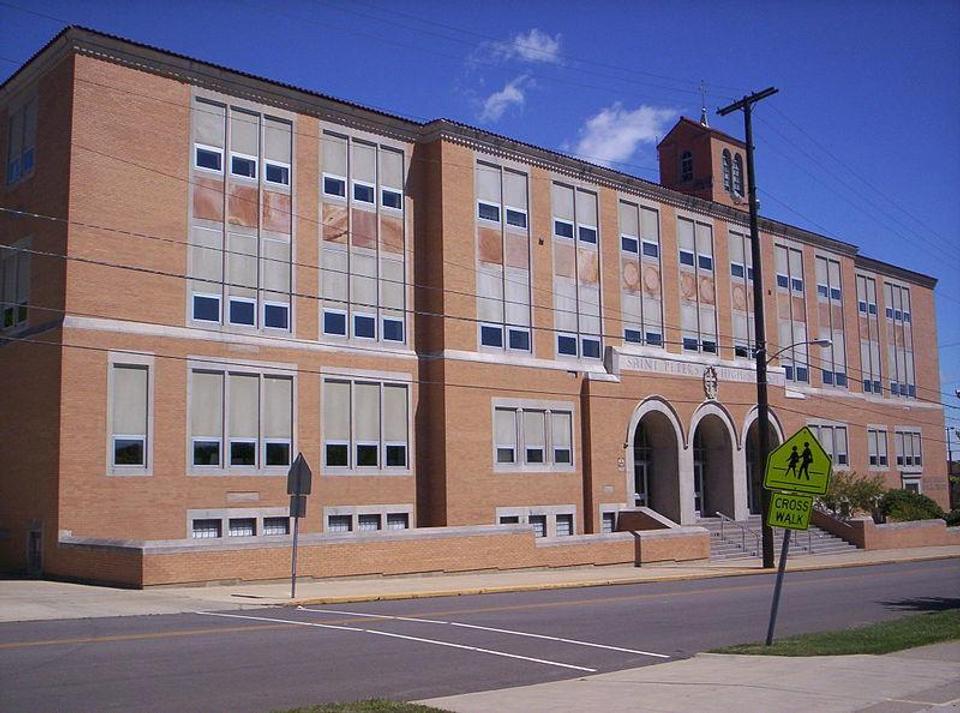
St. Peter's High School Photo
Gr: 7-12 | 136 students
Sports: 13 | Extracurriculars: 8
Catholic
104 W 1st St
Mansfield, OH 44902
(419) 524-2572
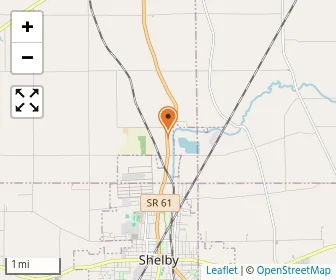
Map of Sacred Heart School
Gr: PK-7 | 98 students
Catholic
5754 State Route 61 S
Shelby, OH 44875
(419) 683-1697
Map of Temple-christian School
Gr: PK-12 | 149 students
Avg. class size: 11 students
Sports: 3
Christian
752 North Stewart Rd
Mansfield, OH 44905
(419) 589-9707
(3)
[+] Show Closed Private Schools in Richland County, Ohio

Richland County Private Elementary Schools (Closed)

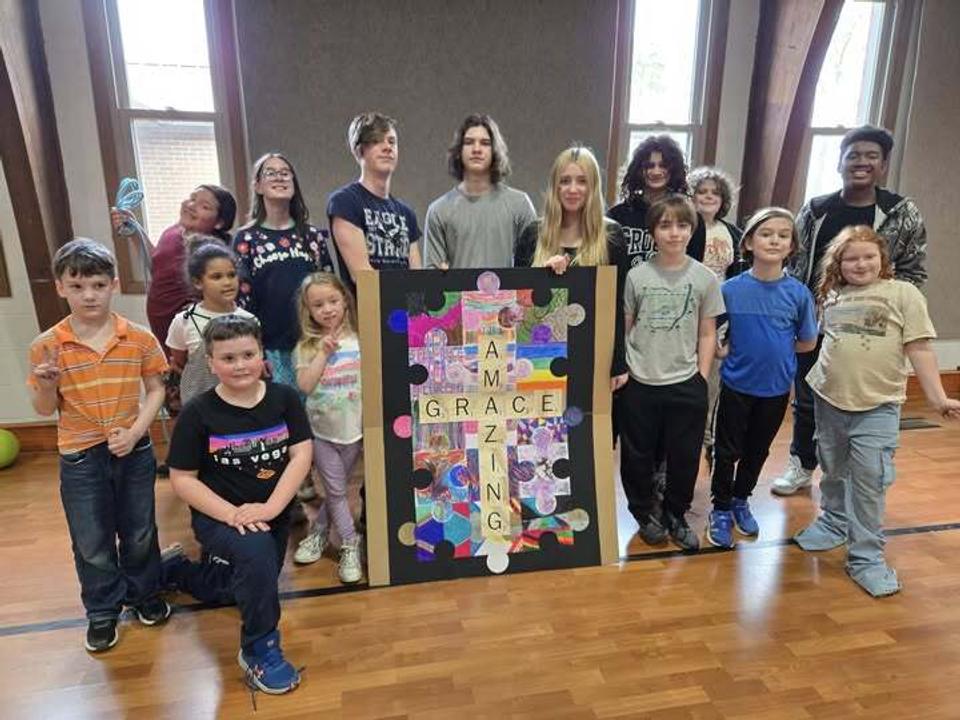
Map of Grace Christian School
Gr: K-9 | 42 students
Brethren
215 W Main St
Mansfield, OH 44904
(419) 884-1780

Overview

Category
This State (OH)
US
# Schools
10 Schools

Showing 2016–2025. Full 11-year historical data available below ↓

# Students
1,688 Students
185,222 Students

Showing 2016–2025. Full 11-year historical data available below ↓

% Average Students of Color
15%
25%

Showing 2016–2025. Full 11-year historical data available below ↓

Academics and Faculty:

# Teachers
153 Teachers
16,065 Teachers
Average Student-Teacher Ratio
11:1
12:1

Showing 2016–2025. Full 11-year historical data available below ↓

% Average Faculty w/Advanced Degree
54%
49%
Average Class Size
15 students
18 students
Average Number of AP Courses
8 courses
12 courses

Tuition and Acceptance Rate:

Average Yearly Tuition Cost
$6,200
$7,977
Average % on Financial Aid
78%
51%
Average Financial Aid Grant
$6,617
$5,255
Average Acceptance Rate
77%
87%
Average Endowment Size
$2.9 million
$24.65 million

Students by Ethnicity:

0.49
0.58

Showing 2016–2025. Full 11-year historical data available below ↓

# American Indian Students
0 Students
1,242 Students
% American Indian Students
0%
1%
# Asian Students
29 Students
4,126 Students
% Asian Students
1%
2%

Showing 2016–2025. Full 11-year historical data available below ↓

# Hispanic Students
59 Students
9,191 Students
% Hispanic Students
3%
5%

Showing 2016–2025. Full 11-year historical data available below ↓

# Black Students
113 Students
19,125 Students
% Black Students
6%
10%

Showing 2016–2025. Full 11-year historical data available below ↓

# White Students
1,377 Students
114,859 Students
% White Students
68%
61%

Showing 2016–2025. Full 11-year historical data available below ↓

# Hawaiian Students
4 Students
235 Students
% Hawaiian Students
<1%
<1%
# Others Students
454 Students
40,221 Students
% of Others Students
22%
21%

Showing 2016–2025. Full 11-year historical data available below ↓

All Ethnic Groups

Extracurriculars and Sports:

Average Number of Extracurriculars
7 extracurriculars
9 extracurriculars
Average Number of Sports
5 sports
6 sports

Frequently Asked Questions

What are the top ranked private elementary schools in Richland County, OH?
The top ranked private elementary schools in Richland County, OH include St. Peter's Elementary School, St. Mary Catholic School, and Discovery School.
How many private elementary schools are located in Richland County?
9 private elementary schools are located in Richland County.
How diverse are private elementary schools in Richland County?
Richland County private elementary schools are approximately 15% minority students, which is lower than the Ohio private school average of 25%.
What percentage of private elementary schools are religiously affiliated in Richland County?
80% of private elementary schools in Richland County are religiously affiliated (most commonly Catholic and Christian).
Which private elementary schools in Richland County are often viewed compared to one another?

Recent Articles

When a Private School Changes Head of School
A private school leadership change can raise important questions. Learn how to evaluate head of school transitions, identify warning signs, and protect your child's educational experience before enrolling confidently.
Private School Financial Aid Renewal: Could Awards Shrink?
Could your private school financial aid shrink next year? Learn why awards change, how income and school budgets affect renewal, and what parents can do to protect affordability long-term.
Need-Blind vs. Need-Aware Private School Admissions
Understand how need-blind and need-aware private school admissions affect acceptance decisions, financial aid eligibility, and affordability, with practical guidance to help parents compare schools, ask questions, and plan confidently ahead.

Filter Schools

School Level
Must Offer Grade
Show more
Gender
School Focus
Religious Affiliation
ADD/ADHD Support
Summer Program

Quick Links