Champaign County Private Schools

For the 2026-27 school year, there are 25 private schools serving 2,997 students in Champaign County, IL (there are 65 public schools, serving 25,404 public students). 11% of all K-12 students are educated in private schools (compared to the IL state average of 12%).
The average tuition cost is $11,356, which is higher than the Illinois private school average tuition cost of $10,412.
44% of private schools in Champaign County, IL are religiously affiliated (most commonly Catholic and Christian).

Quick Facts (26-27)

  • # Private Schools: 25
  • # Students Served: 2,997
  • Average Tuition: $11,356
  • % Students on Financial Aid: 27%
  • Acceptance Rate: 77%
  • Average Class Size: 18 students
  • % Students of Color: 32%
  • View Champaign County, IL School Trends
Quick Facts (26-27)

  • # Private Schools: 25
  • # Students Served: 2,997
  • Average Tuition: $11,356
  • % Students on Financial Aid: 27%
  • Acceptance Rate: 77%
  • Average Class Size: 18 students
  • % Students of Color: 32%
  • View Champaign County, IL School Trends
Top Ranked Champaign County Private Schools (2026-27)

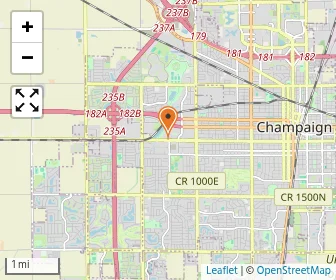
Chesterbrook Academy Preschool of Champaign - Research Park Photo
Gr: PK-K | 186 students
Alternative School
2001 S. Oak St, Suite A
Champaign, IL 61820
(217) 279-4438
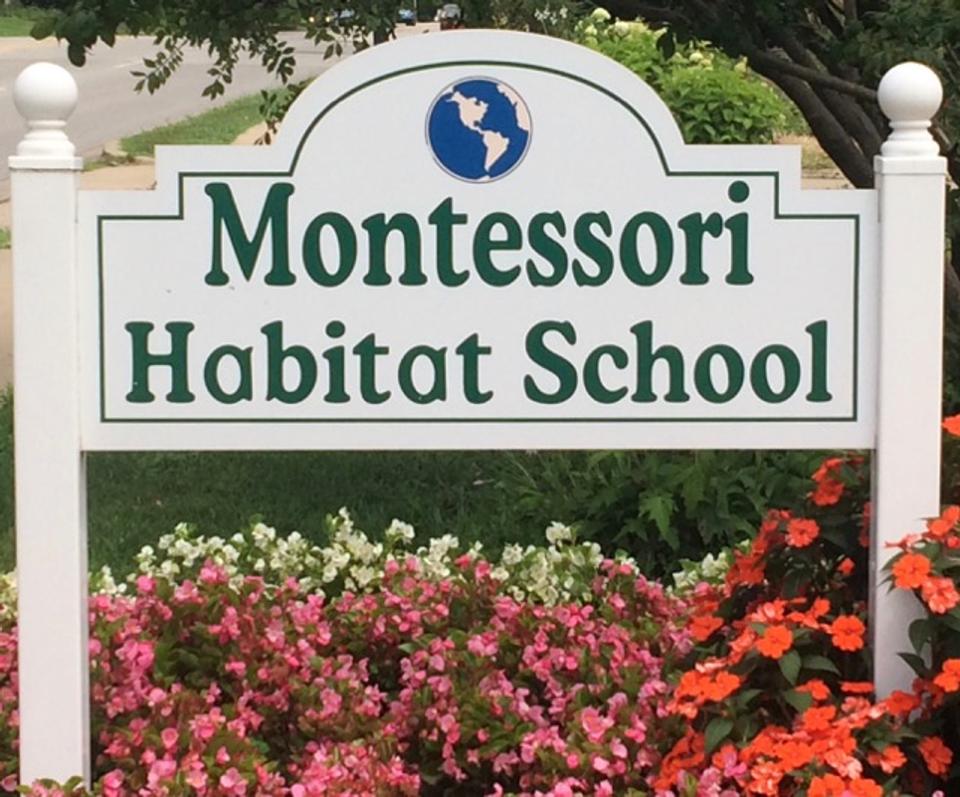
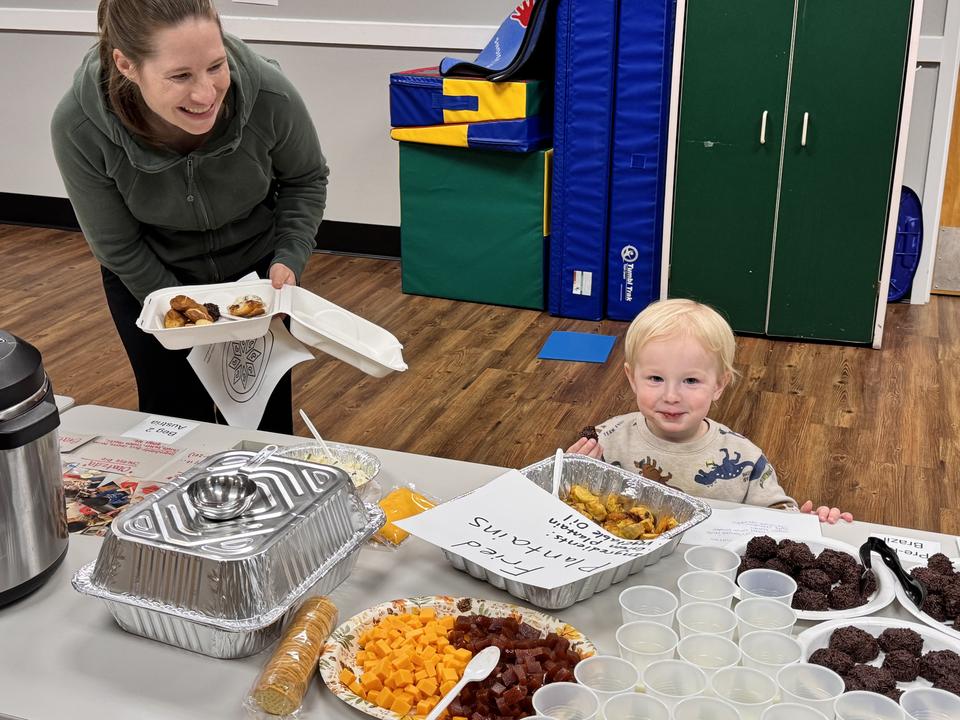
Montessori Habitat Photo
Gr: PK-8 | 86 students
Avg. class size: 25 students
Extracurriculars: 1
Montessori School
801 & 805 West Kirby Avenue
Champaign, IL 61820
(217) 366-3260
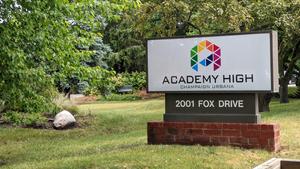
Academy High Photo
Gr: 9-12 | 48 students
Sports: 8 | Extracurriculars: 7
2001 Fox Drive
Champaign, IL 61820
(217) 239-6000
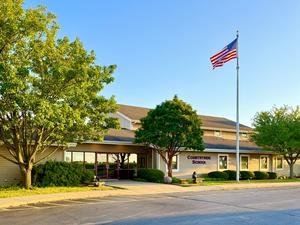
Countryside School Photo
Gr: K-8 | 156 students
Avg. class size: 15 students
Sports: 3 | Extracurriculars: 7
4301 W Kirby Avenue
Champaign, IL 61822
(217) 355-1253
Holy Cross Elementary School Photo
Gr: PK-8 | 231 students
Avg. class size: 24 students
Sports: 7 | Extracurriculars: 4
Catholic
410 W White St
Champaign, IL 61820
(217) 356-9521
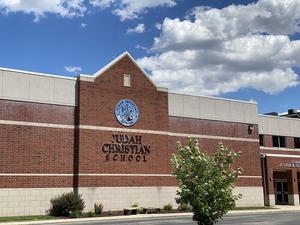
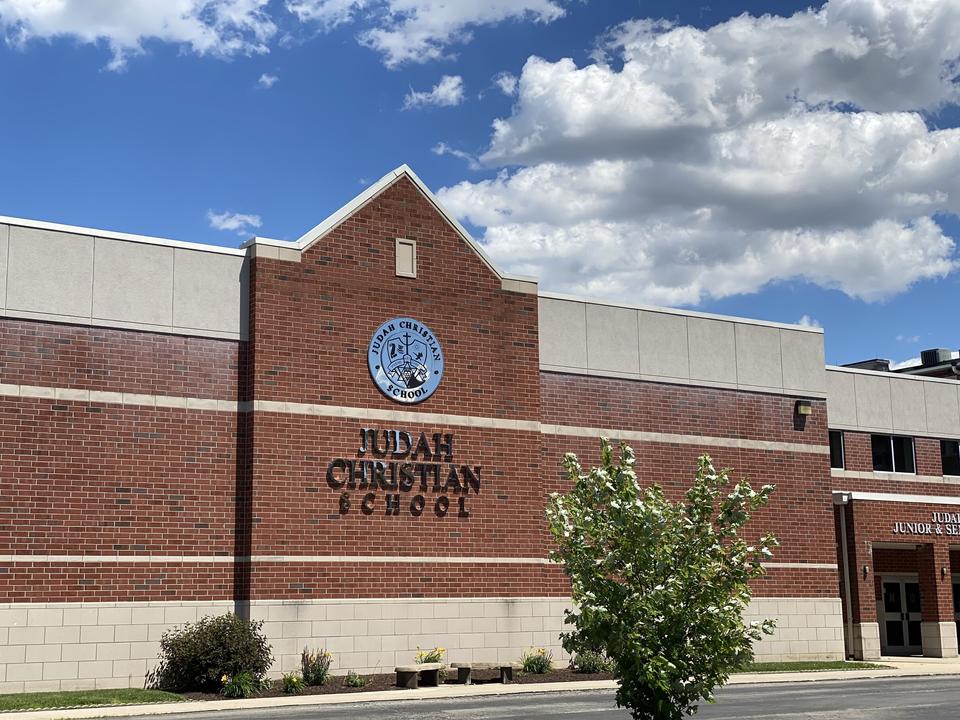
Judah Christian School Photo
Gr: PK-12 | 305 students
Avg. class size: 20 students
Sports: 11 | Extracurriculars: 9
Christian
908 N Prospect Avenue
Champaign, IL 61820
(217) 359-1701
(1)
Map of Next Generation School
Gr: K-8 | 264 students
Avg. class size: 30 students
Sports: 5 | Extracurriculars: 6
2521 Galen Drive
Champaign, IL 61821
(217) 356-6995
(3)
St. Matthew School Photo
Gr: PK-8 | 383 students
Sports: 8
Catholic
1307 Lincolnshire Dr
Champaign, IL 61821
(217) 359-4114
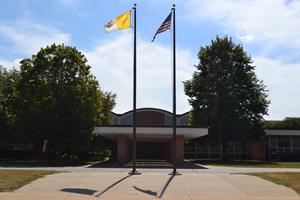
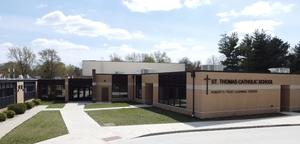
St. Thomas Catholic Elementary School Photo
Gr: PK-8 | 182 students
Avg. class size: 15 students
Sports: 8 | Extracurriculars: 2
Catholic
311 E Madison St
Philo, IL 61864
(217) 684-2309
Map of Calvary Baptist Christian Academy
Gr: K-12 | 46 students
Baptist
2106 E Windsor Ln
Urbana, IL 61802
(217) 367-2262
Map of Campus Middle School For Girls
Gr: 6-8 | 33 students
Avg. class size: 12 students
Sports: 2 | Extracurriculars: 2
All-girls
108 S. Webber Street
Urbana, IL 61802
(217) 344-8279
Map of Canaan Academy
Gr: K-6 | 50 students
Christian
207 N Central Ave
Urbana, IL 61801
(217) 367-6590
Map of Circle Academy
Gr: 1-12 | 64 students
Alternative School
1303 N Cunningham Ave, Urbana, IL 61802
Urbana, IL 61802
(217) 367-6923
Devonshire KinderCare Photo
Gr: NS-PK | 49 students
Daycare / Preschool
410 Devonshire Dr
Champaign, IL 61820
(217) 356-9000
Map of First School
Gr: PK-1 | 75 students
Daycare / Preschool
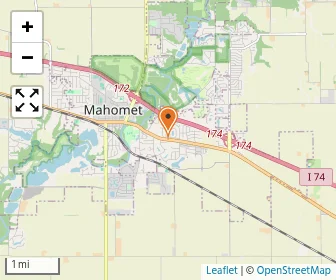
1403 E Oak St
Mahomet, IL 61853
(217) 586-9990
The High School Of Saint Thomas More Photo
Gr: 9-12 | 210 students
Avg. class size: 15 students
Sports: 13 | Extracurriculars: 19
Catholic
3901 N Mattis Ave
Champaign, IL 61822
(217) 352-7201
Map of Kingswood School
Gr: 2-11 | 7 students
Methodist
2111 N. Willow Road
Urbana, IL 61801
(217) 344-5540
(1)
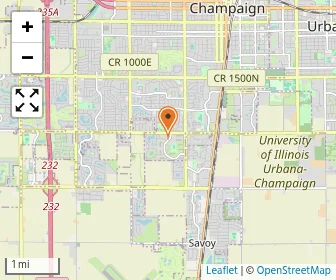
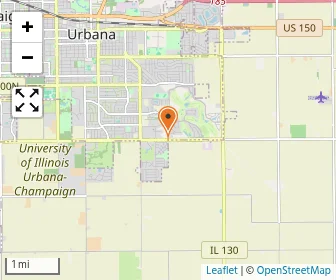
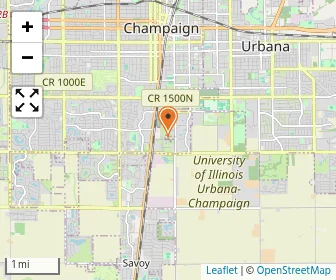
Montessori School Of Champaign-urbana Photo
Gr: PK-7 | 132 students
Avg. class size: 20 students
Extracurriculars: 6
Montessori School
1403 Regency Drive East
Savoy, IL 61874
(217) 356-1818
(1)
Map of Next Generation Early Education
Gr: NS-PK
Avg. class size: 20 students
Daycare / Preschool
1201 West WIndsor Rd.
Champaign, IL 61821
(217) 356-6398
Map of Pavilion Foundation School
Gr: 2-12 | 51 students
Avg. class size: 10 students
Special Education School
810 W Church St
Champaign, IL 61820
(217) 549-1213
St. John Lutheran School and Little Lamb Preschool Photo
Gr: PK-8 | 126 students
Avg. class size: 15 students
Sports: 4 | Extracurriculars: 3
Lutheran Church Missouri Synod
509 S Mattis Ave
Champaign, IL 61821
(217) 359-1714
Map of St. Malachy School
Gr: PK-8 | 195 students
Avg. class size: 17 students
Catholic
340 E Belle Ave
Rantoul, IL 61866
(217) 892-2011
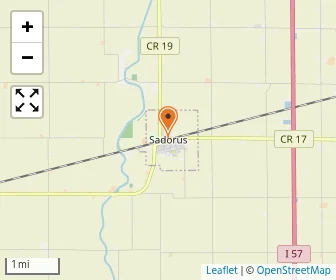
Map of St. Paul Lutheran School
Gr: PK-5 | 38 students
Lutheran Church Missouri Synod
101 E Church St
Sadorus, IL 61872
(217) 598-2459
Map of Swann Special Care Ctr-elem/secondary School
Gr: PK | 15 students
Special Education School
2418 W Springfield Ave
Champaign, IL 61821
(217) 398-9270
Map of University Primary School
Gr: PK-5 | 65 students
51 Gerty Dr
Champaign, IL 61820
(217) 333-3996
[+] Show Closed Private Schools in Champaign County, Illinois

Champaign County Private Schools (Closed)

Map of Swann Elementary School
Gr: NS | 30 students
Special Education School
2422 W Springfield Ave
Champaign, IL 61821
(217) 398-9270

Overview

Category
This State (IL)
US
# Schools
25 Schools

Showing 2016–2025. Full 11-year historical data available below ↓

Private schools flat at 25 in Champaign County, with the count ending 2025 where it started in 2016.
# Students
2,997 Students
250,469 Students

Showing 2016–2025. Full 11-year historical data available below ↓

Private school size down 13 students in Champaign County, from 138 in 2016 to 125 in 2025.
% Average Students of Color
32%
34%

Showing 2016–2025. Full 11-year historical data available below ↓

Students of color up 6 points in Champaign County private schools, from 25% in 2016 to 31% in 2025.

Academics and Faculty:

# Teachers
298 Teachers
18,914 Teachers
Average Student-Teacher Ratio
11:1
13:1

Showing 2016–2025. Full 11-year historical data available below ↓

Student-teacher ratio down 1 in Champaign County private schools, from 12:1 in 2016 to 11:1 in 2025, while Illinois stayed at 13:1.
% Average Faculty w/Advanced Degree
51%
53%
Average Class Size
18 students
17 students

Showing 2016–2025. Full 11-year historical data available below ↓

Average Number of AP Courses
7 courses
11 courses
Average SAT score
1062
(Out of 1600)
1259
Average ACT score
24
(Out of 36)
25

Tuition and Acceptance Rate:

Average Yearly Tuition Cost
$11,356
$10,412

Showing 2016–2025. Full 11-year historical data available below ↓

Tuition rose 26% in Champaign County private schools, from $8,974 in 2016 to $11,304 in 2025.
Average Summer Program Cost
$150
$961
Average % on Financial Aid
27%
35%
Average Financial Aid Grant
$6,750
$4,570
Average Acceptance Rate
77%
89%

Students by Ethnicity:

0.63
0.66

Showing 2016–2025. Full 11-year historical data available below ↓

Diversity score up 12 points in Champaign County private schools, from 0.51 in 2016 to 0.63 in 2025.
# American Indian Students
14 Students
605 Students
% American Indian Students
<1%
<1%
# Asian Students
255 Students
10,480 Students
% Asian Students
8%
4%

Showing 2016–2025. Full 11-year historical data available below ↓

Asian enrollment up 4 points in Champaign County private schools, rising from 4% in 2016 to 8% in 2025.
# Hispanic Students
169 Students
25,029 Students
% Hispanic Students
5%
10%

Showing 2016–2025. Full 11-year historical data available below ↓

Hispanic share down 6 points in Champaign County private schools, from 11% in 2020 to 5% in 2025.
# Black Students
244 Students
21,042 Students
% Black Students
8%
9%

Showing 2016–2025. Full 11-year historical data available below ↓

Black students up 4 points in Champaign County private schools, from 4% in 2016 to 8% in 2025.
# White Students
1,783 Students
128,851 Students
% White Students
56%
51%

Showing 2016–2025. Full 11-year historical data available below ↓

White share down 11 points in Champaign County private schools, from 67% in 2016 to 56% in 2025.
# Hawaiian Students
1 Student
338 Students
% Hawaiian Students
<1%
<1%
# Others Students
739 Students
65,188 Students
% of Others Students
23%
26%

Showing 2016–2025. Full 11-year historical data available below ↓

Other-race share fell 12 points in Champaign County private schools, from 35% in 2023 to 23% in 2025.
All Ethnic Groups

Extracurriculars and Sports:

Average Number of Extracurriculars
6 extracurriculars
9 extracurriculars
Average Number of Sports
7 sports
6 sports

Frequently Asked Questions

What are the top ranked private schools in Champaign County, IL?
The top ranked private schools in Champaign County, IL include Holy Cross Elementary School, Judah Christian School, and Countryside School.
How many private schools are located in Champaign County?
25 private schools are located in Champaign County.
How much do private schools cost in Champaign County?
The average tuition cost is $11,356, which is higher than the Illinois private school average tuition cost of $10,412.
How diverse are private schools in Champaign County?
Champaign County private schools are approximately 32% minority students, which is lower than the Illinois private school average of 34%.
What percentage of students in Champaign County go to private school?
11% of all K-12 students in Champaign County are educated in private schools (compared to the IL state average of 12%).
What percentage of private schools are religiously affiliated in Champaign County?
44% of private schools in Champaign County are religiously affiliated (most commonly Catholic and Christian).
Which private schools in Champaign County are often viewed compared to one another?

Recent Articles

When a Private School Changes Head of School
A private school leadership change can raise important questions. Learn how to evaluate head of school transitions, identify warning signs, and protect your child's educational experience before enrolling confidently.
Private School Financial Aid Renewal: Could Awards Shrink?
Could your private school financial aid shrink next year? Learn why awards change, how income and school budgets affect renewal, and what parents can do to protect affordability long-term.
Need-Blind vs. Need-Aware Private School Admissions
Understand how need-blind and need-aware private school admissions affect acceptance decisions, financial aid eligibility, and affordability, with practical guidance to help parents compare schools, ask questions, and plan confidently ahead.

Filter Schools

School Level
Must Offer Grade
Show more
Gender
School Focus
Religious Affiliation
ADD/ADHD Support
Summer Program

Quick Links