Clark County Private Schools

For the 2026-27 school year, there are 12 private schools serving 2,302 students in Clark County, OH (there are 43 public schools, serving 20,812 public students). 10% of all K-12 students are educated in private schools (compared to the OH state average of 12%).
The average acceptance rate is 90%, which is higher than the Ohio private school average acceptance rate of 88%.
75% of private schools in Clark County, OH are religiously affiliated (most commonly Catholic and Christian).

Quick Facts (26-27)

Quick Facts (26-27)

Top Ranked Clark County Private Schools (2026-27)

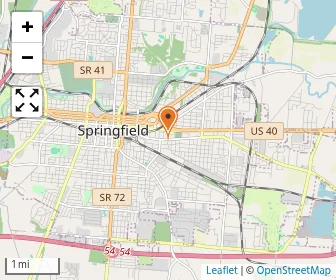
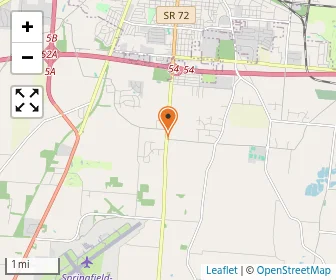
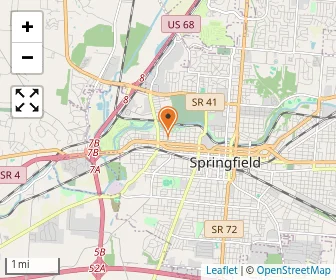
Map of Catholic Central
Gr: PK-12 | 593 students
Avg. class size: 22 students
Sports: 14
Catholic
1200 E High St
Springfield, OH 45505
(937) 325-9204
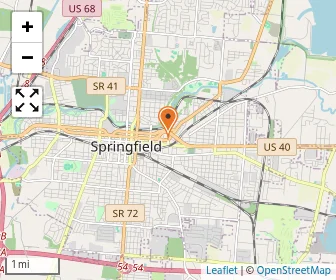
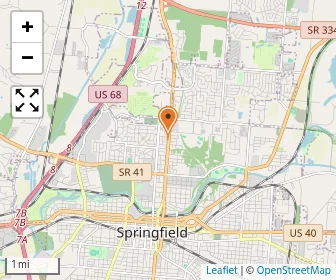
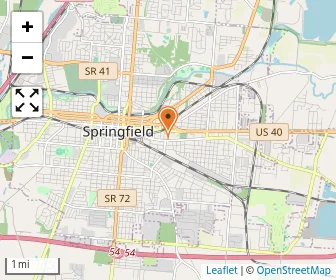
Map of Catholic Central School
Gr: PK-12 | 457 students
Catholic
800 Lagonda Ave
Springfield, OH 45503
(937) 325-9204
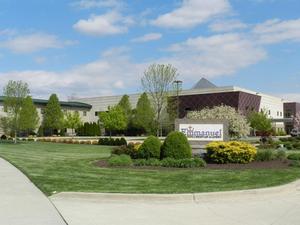
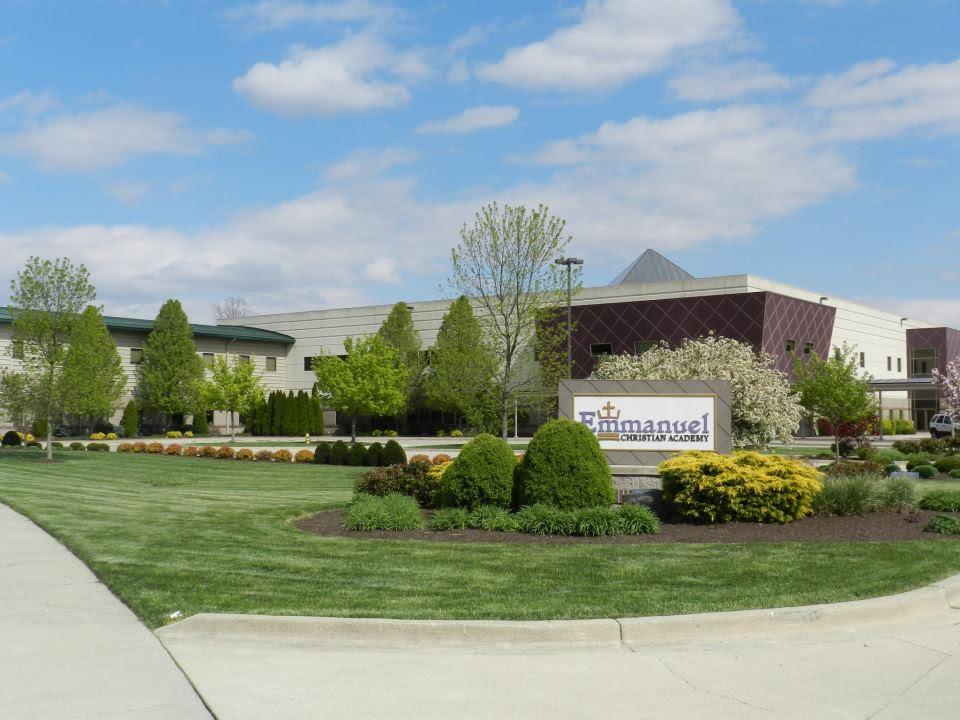
Emmanuel Christian Academy Photo
Gr: K-12 | 377 students
Avg. class size: 20 students
Sports: 9 | Extracurriculars: 4
Christian
2177 Emmanuel Way
Springfield, OH 45502
(937) 390-3777
(9)
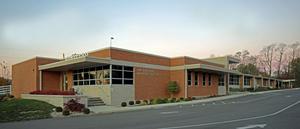
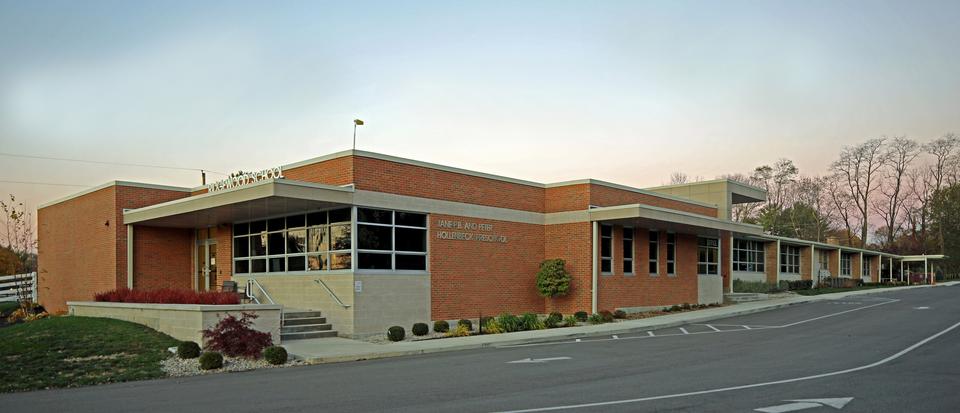
Ridgewood School Photo
Gr: PK-8 | 162 students
Avg. class size: 15 students
Sports: 1 | Extracurriculars: 13
2420 Saint Paris Pike
Springfield, OH 45504
(937) 399-8900
(2)
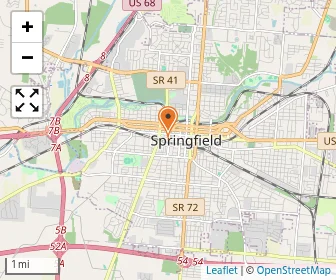
Map of Risen Christ Lutheran School
Gr: PK-8 | 140 students
Sports: 1 | Extracurriculars: 11
Lutheran Church Missouri Synod
41 E Possum Rd
Springfield, OH 45502
(937) 323-3688
(2)
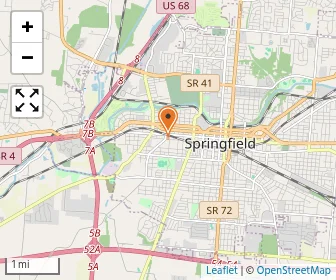
Map of Catholic Central Elementary - Limestone Campus
Gr: K-7 | 256 students
Catholic
1817 N Limestone St
Springfield, OH 45503
(937) 399-5451
Map of Covenant Childrens Academy
Gr: PK-K | 18 students
Daycare / Preschool (Presbyterian)
201 N Limestone St
Springfield, OH 45503
(937) 325-2427
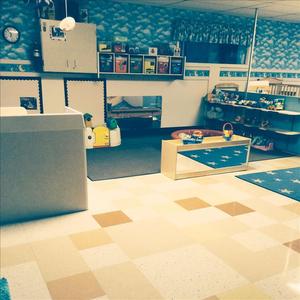
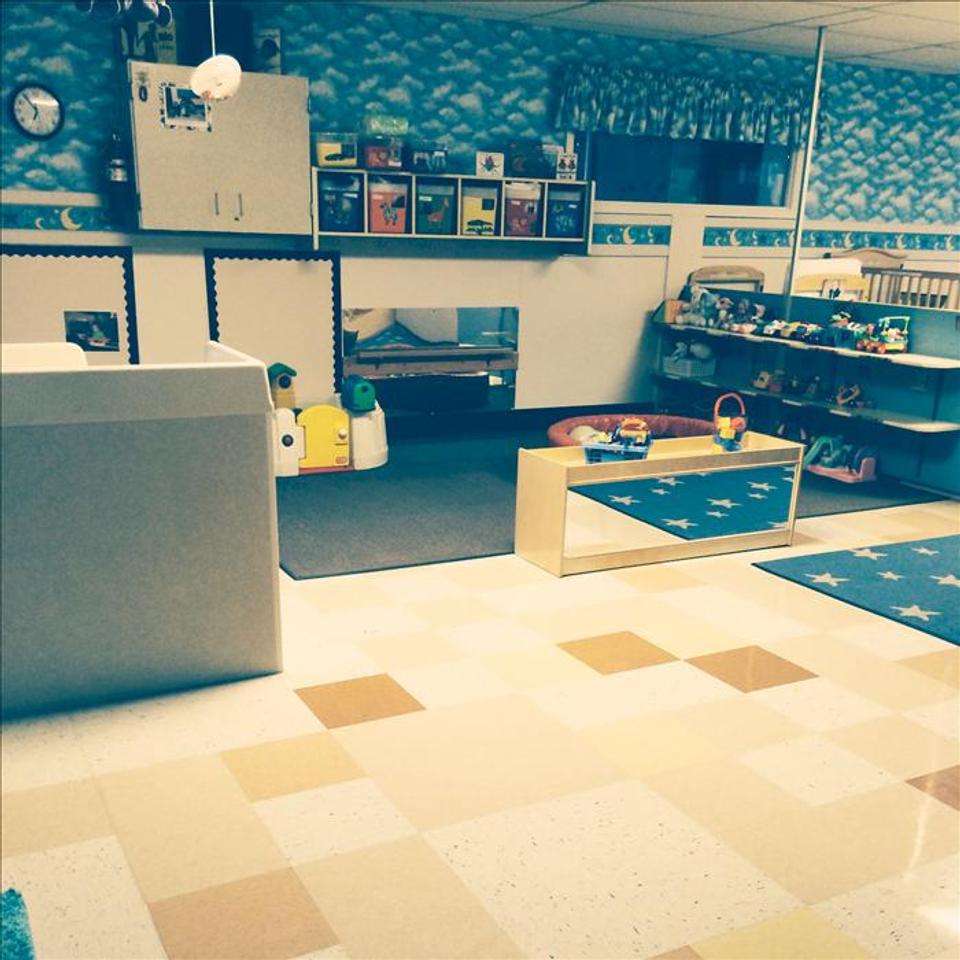
Derr Road KinderCare Photo
Gr: NS-PK
Daycare / Preschool
4560 Derr Rd.
Springfield, OH 45503
(937) 399-3795
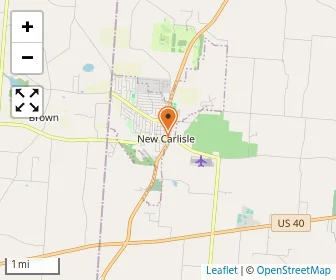
Map of Guiding Shepherd Christian School
Gr: K-12 | 29 students
Christian
220 S Main St
New Carlisle, OH 45344
(937) 845-3292
Map of Maiden Lane Educare
Gr: K-1 | 12 students
Church of God
1201 Maiden Ln
Springfield, OH 45504
(937) 325-6528
Map of Nightingale Montessori
Gr: PK-12 | 150 students
Montessori School
1106 E High St
Springfield, OH 45505
(937) 324-0336
Map of Springfield Christian School
Gr: PK-8 | 108 students
Christian
311 W High St
Springfield, OH 45506
(937) 325-3113
[+] Show Closed Private Schools in Clark County, Ohio

Clark County Private Schools (Closed)

Map of Holy Trinity School
Gr: PK-8 | 146 students
Catholic
1035 W High Street
Springfield, OH 45506
(937) 322-8781
Map of St. John S Lutheran School & Child Care
Gr: NS | 31 students
Avg. class size: 10 students
Daycare / Preschool (Evangelical Lutheran Church in America (formerly AELC, ALC, or LCA))
27 N Wittenberg Ave
Springfield, OH 45502
(937) 325-4311

Overview

Category
This State (OH)
US
# Schools
12 Schools

Showing 2016–2025. Full 11-year historical data available below ↓

Private schools flat at 12 in Clark County, after rising to 13 in 2018-2021 and returning to 12 in 2022-2025.
# Students
2,302 Students
232,121 Students

Showing 2016–2025. Full 11-year historical data available below ↓

Average students up 59 in Clark County private schools, rising from 149 in 2016 to 208 in 2025.
% Average Students of Color
23%
25%

Showing 2016–2025. Full 11-year historical data available below ↓

Students of color down 8 points in Clark County private schools, from 31% in 2016 to 23% in 2025.

Academics and Faculty:

# Teachers
187 Teachers
19,163 Teachers
Average Student-Teacher Ratio
12:1
13:1

Showing 2016–2025. Full 11-year historical data available below ↓

Student-teacher ratio down 1 in Clark County, from 13:1 in 2024 to 12:1 in 2025.
% Average Faculty w/Advanced Degree
60%
51%
Average Class Size
19 students
17 students
Average Number of AP Courses
3 courses
12 courses
Average SAT score
1325
(Out of 1600)
1239
Average ACT score
22
(Out of 36)
25

Tuition and Acceptance Rate:

Average Yearly Tuition Cost
$7,931
$8,791
Tuition rose 12% in Clark County, from $5,711 in 2021 to $6,381 in 2025, still below Ohio's $8,453.
Average Summer Program Cost
$65
$425
Average % on Financial Aid
75%
52%
Average Acceptance Rate
90%
88%
Average Endowment Size
$1.5 million
$23.04 million

Students by Ethnicity:

0.59
0.59

Showing 2016–2025. Full 11-year historical data available below ↓

Diversity score up 4 points in Clark County private schools, rising from 0.55 in 2016 to 0.59 in 2025.
# American Indian Students
0 Students
1,332 Students
% American Indian Students
0%
1%
# Asian Students
42 Students
5,039 Students
% Asian Students
2%
2%

Showing 2016–2025. Full 11-year historical data available below ↓

# Hispanic Students
82 Students
10,835 Students
% Hispanic Students
4%
5%

Showing 2016–2025. Full 11-year historical data available below ↓

Hispanic share down 2 points in Clark County private schools, from 6% in 2016 to 4% in 2025.
# Black Students
241 Students
24,257 Students
% Black Students
10%
10%

Showing 2016–2025. Full 11-year historical data available below ↓

Black student share steady in Clark County private schools, holding near 11% in 2016 and 2025 after peaking at 14% in 2020.
# White Students
1,315 Students
139,899 Students
% White Students
57%
59%

Showing 2016–2025. Full 11-year historical data available below ↓

White share down 8 points in Clark County private schools, from 65% in 2016 to 57% in 2025.
# Hawaiian Students
0 Students
309 Students
% Hawaiian Students
0%
<1%
# Others Students
624 Students
54,253 Students
% of Others Students
27%
23%

Showing 2016–2025. Full 11-year historical data available below ↓

Other-race enrollment up 10 points in Clark County private schools, rising from 16% in 2016 to 26% in 2025.
All Ethnic Groups

Extracurriculars and Sports:

Average Number of Extracurriculars
9 extracurriculars
9 extracurriculars
Average Number of Sports
6 sports
7 sports

Frequently Asked Questions

What are the top ranked private schools in Clark County, OH?
The top ranked private schools in Clark County, OH include Catholic Central School, Emmanuel Christian Academy, and Ridgewood School.
How many private schools are located in Clark County?
12 private schools are located in Clark County.
How diverse are private schools in Clark County?
Clark County private schools are approximately 23% minority students, which is lower than the Ohio private school average of 25%.
What percentage of students in Clark County go to private school?
10% of all K-12 students in Clark County are educated in private schools (compared to the OH state average of 12%).
What percentage of private schools are religiously affiliated in Clark County?
75% of private schools in Clark County are religiously affiliated (most commonly Catholic and Christian).
Which private schools in Clark County are often viewed compared to one another?

Recent Articles

When a Private School Changes Head of School
A private school leadership change can raise important questions. Learn how to evaluate head of school transitions, identify warning signs, and protect your child's educational experience before enrolling confidently.
Private School Financial Aid Renewal: Could Awards Shrink?
Could your private school financial aid shrink next year? Learn why awards change, how income and school budgets affect renewal, and what parents can do to protect affordability long-term.
Need-Blind vs. Need-Aware Private School Admissions
Understand how need-blind and need-aware private school admissions affect acceptance decisions, financial aid eligibility, and affordability, with practical guidance to help parents compare schools, ask questions, and plan confidently ahead.

Filter Schools

School Level
Must Offer Grade
Show more
Gender
School Focus
Religious Affiliation
ADD/ADHD Support
Summer Program

Quick Links