Newport County Private Schools

For the 2026-27 school year, there are 11 private schools serving 1,874 students in Newport County, RI (there are 21 public schools, serving 8,001 public students). 19% of all K-12 students are educated in private schools (compared to the RI state average of 15%).
The average acceptance rate is 45%, which is lower than the Rhode Island private school average acceptance rate of 79%.
33% of private schools in Newport County, RI are religiously affiliated (most commonly Catholic and Episcopal).

Quick Facts (26-27)

  • # Private Schools: 11
  • # Students Served: 1,874
  • Average Tuition: $39,741
  • % Students on Financial Aid: 38%
  • Acceptance Rate: 45%
  • Average Class Size: 14 students
  • % Students of Color: 13%
  • View Newport County, RI School Trends
Quick Facts (26-27)

  • # Private Schools: 11
  • # Students Served: 1,874
  • Average Tuition: $39,741
  • % Students on Financial Aid: 38%
  • Acceptance Rate: 45%
  • Average Class Size: 14 students
  • % Students of Color: 13%
  • View Newport County, RI School Trends
Top Ranked Newport County Private Schools (2026-27)

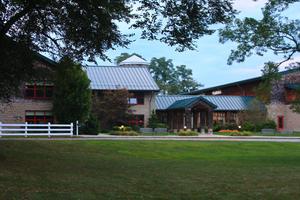
The Pennfield School Photo
Gr: NS-8 | 197 students
Avg. class size: 16 students
Sports: 6 | Extracurriculars: 5
110 Sandy Point Ave Litle Slocum Farm
Portsmouth, RI 02871
(401) 849-4646
(1)
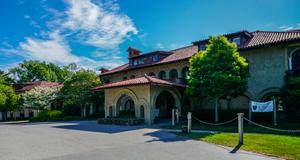
Portsmouth Abbey School Photo
Gr: 9-12 | 337 students
Avg. class size: 12 students
Sports: 18 | Extracurriculars: 22
Catholic
285 Corys Ln
Portsmouth, RI 02871
(401) 643-1248
St. George's School Photo
Gr: 9-12 | 380 students
Avg. class size: 10 students
Sports: 17 | Extracurriculars: 10
Episcopal
372 Purgatory Road
Middletown, RI 02842
(401) 842-6600
(2)
St. Michaels Country Day School Photo
Gr: PK-8 | 221 students
Avg. class size: 12 students
Sports: 8 | Extracurriculars: 5
180 Rhode Island Ave
Newport, RI 02840
(401) 849-5970
(1)
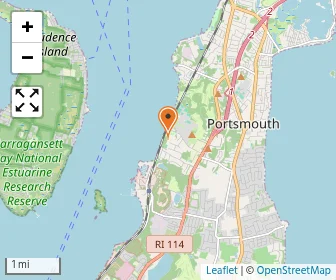
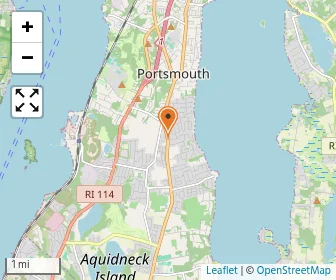
Map of Saint Philomena School of the Sacred Heart
Gr: NS-8 | 455 students
Avg. class size: 22 students
Sports: 8 | Extracurriculars: 10
Catholic
324 Cory's Lane
Portsmouth, RI 02871
(401) 683-0268
(3)
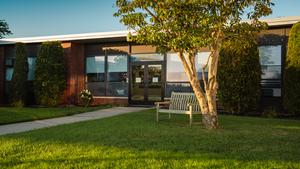
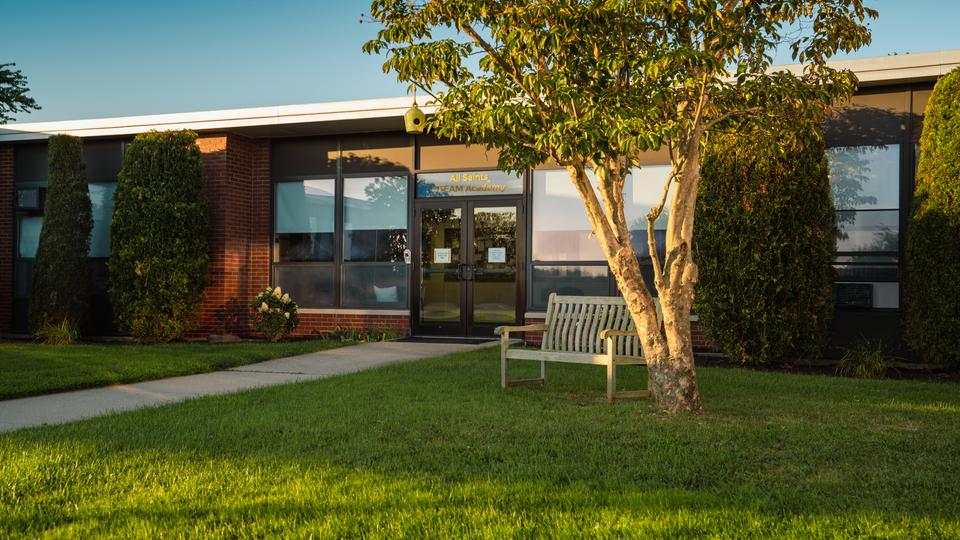
All Saints STEAM Academy Photo
Gr: NS-8
Avg. class size: 15 students
Extracurriculars: 5
Catholic
915 West Main Road
Middletown, RI 02842
(401) 848-4300
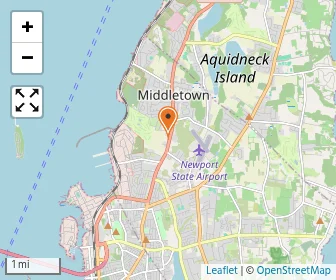
Map of Beginnings-the Children's School
Gr: K | 5 students
Montessori School
1985 East Main Road
Portsmouth, RI 02871
(401) 683-5850
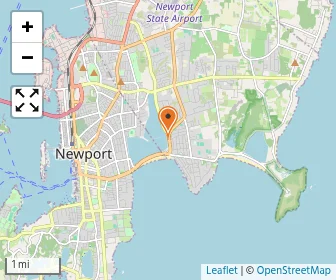
Map of The Bradley School
Gr: 1-12 | 78 students
Special Education School
2820 E Main Rd
Portsmouth, RI 02871
(401) 606-8300
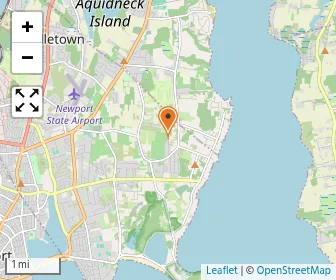
Map of Bright Ideas Preschool
Gr: NS-K | 50 students
Avg. class size: 10 students
Daycare / Preschool
1272 W Main Rd
Middletown, RI 02842
(401) 849-0055
Map of Kinderart Preschool
Gr: K | 43 students
Daycare / Preschool
146 Aquidneck Ave
Middletown, RI 02842
(401) 847-0685
Map of Silveira Kindergarten & Nursery School
Gr: PK-K | 88 students
Daycare / Preschool
143 Peckham Ln
Middletown, RI 02842
(401) 846-9251
(2)
[+] Show Closed Private Schools in Newport County, Rhode Island

Newport County Private Schools (Closed)

Map of James L Maher School
Gr: 4-12 | 6 students
Special Education School
Po Box 4390
Middletown, RI 02842
(401) 846-0340

Overview

Category
This State (RI)
US
# Schools
12 Schools

Showing 2016–2025. Full 11-year historical data available below ↓

Private schools down 2 in Newport County, from 14 in 2016 to 12 in 2025.
# Students
1,874 Students
22,902 Students

Showing 2016–2025. Full 11-year historical data available below ↓

School size up 8 students in Newport County, the average private school grew from 162 students in 2016 to 170 in 2025.
% Average Students of Color
13%
28%

Showing 2016–2025. Full 11-year historical data available below ↓

Students of color fell 3 points in Newport County private schools, from 16% in 2016 to 13% in 2025, while Rhode Island rose to 29%.

Academics and Faculty:

# Teachers
251 Teachers
2,320 Teachers
Average Student-Teacher Ratio
8:1
10:1

Showing 2016–2025. Full 11-year historical data available below ↓

% Average Faculty w/Advanced Degree
71%
56%
Average Class Size
14 students
15 students

Showing 2016–2025. Full 11-year historical data available below ↓

Average Number of AP Courses
20 courses
14 courses
Average SAT score
1400
(Out of 1600)
Average ACT score
31
(Out of 36)

Tuition and Acceptance Rate:

Average Yearly Tuition Cost
$39,741
$19,241
Average Summer Program Cost
$350
$0
Average % on Financial Aid
38%
43%

Showing 2016–2025. Full 11-year historical data available below ↓

Average Financial Aid Grant
$20,850
$9,473
Grant aid highest in county as Newport County’s average private-school financial aid rose from $18,870 in 2017 to $20,850 in 2025, far above Rhode Island and the U.S.
Average Acceptance Rate
45%
79%
Average Endowment Size
$137.5 million
$33.8 million

Students by Ethnicity:

0.46
0.61

Showing 2016–2025. Full 11-year historical data available below ↓

Diversity score up slightly in Newport County private schools, rising from 0.44 in 2016 to 0.46 in 2025.
# American Indian Students
2 Students
41 Students
% American Indian Students
<1%
<1%
# Asian Students
93 Students
631 Students
% Asian Students
5%
3%

Showing 2016–2025. Full 11-year historical data available below ↓

Asian share down 1 point in Newport County private schools, from 6% in 2016 to 5% in 2025.
# Hispanic Students
50 Students
1,762 Students
% Hispanic Students
2%
8%

Showing 2016–2025. Full 11-year historical data available below ↓

# Black Students
63 Students
1,340 Students
% Black Students
3%
6%

Showing 2016–2025. Full 11-year historical data available below ↓

Black student share steady in Newport County private schools, staying at 3% in 2016 and 2025 while Rhode Island was 6% and the U.S. 7%.
# White Students
1,505 Students
12,205 Students
% White Students
71%
55%

Showing 2016–2025. Full 11-year historical data available below ↓

White share down 2 points in Newport County private schools, from 73% in 2016 to 71% in 2025, while Rhode Island fell from 64% to 55%.
# Hawaiian Students
0 Students
19 Students
% Hawaiian Students
0%
<1%
# Others Students
397 Students
6,065 Students
% of Others Students
19%
28%

Showing 2016–2025. Full 11-year historical data available below ↓

Other-race students up 3 points in Newport County private schools, from 16% in 2016 to 19% in 2025.
All Ethnic Groups

Extracurriculars and Sports:

Average Number of Extracurriculars
10 extracurriculars
13 extracurriculars
Average Number of Sports
11 sports
8 sports

Frequently Asked Questions

What are the top ranked private schools in Newport County, RI?
The top ranked private schools in Newport County, RI include The Pennfield School, Portsmouth Abbey School, and St. George's School.
How many private schools are located in Newport County?
11 private schools are located in Newport County.
How diverse are private schools in Newport County?
Newport County private schools are approximately 13% minority students, which is lower than the Rhode Island private school average of 28%.
What percentage of students in Newport County go to private school?
19% of all K-12 students in Newport County are educated in private schools (compared to the RI state average of 15%).
What percentage of private schools are religiously affiliated in Newport County?
33% of private schools in Newport County are religiously affiliated (most commonly Catholic and Episcopal).
Which private schools in Newport County are often viewed compared to one another?

Recent Articles

When a Private School Changes Head of School
A private school leadership change can raise important questions. Learn how to evaluate head of school transitions, identify warning signs, and protect your child's educational experience before enrolling confidently.
Private School Financial Aid Renewal: Could Awards Shrink?
Could your private school financial aid shrink next year? Learn why awards change, how income and school budgets affect renewal, and what parents can do to protect affordability long-term.
Need-Blind vs. Need-Aware Private School Admissions
Understand how need-blind and need-aware private school admissions affect acceptance decisions, financial aid eligibility, and affordability, with practical guidance to help parents compare schools, ask questions, and plan confidently ahead.

Filter Schools

School Level
Must Offer Grade
Show more
Gender
School Focus
Religious Affiliation
ADD/ADHD Support
Summer Program

Quick Links