Hays County Private Schools

For the 2026-27 school year, there are 15 private schools serving 4,568 students in Hays County, TX (there are 63 public schools, serving 46,231 public students). 9% of all K-12 students are educated in private schools (compared to the TX state average of 6%).
The average acceptance rate is 83%, which is lower than the Texas private school average acceptance rate of 85%.
40% of private schools in Hays County, TX are religiously affiliated (most commonly Christian and Seventh Day Adventist).

Quick Facts (26-27)

  • # Private Schools: 15
  • # Students Served: 4,568
  • Average Tuition: $14,396
  • % Students on Financial Aid: 30%
  • Acceptance Rate: 83%
  • Average Class Size: 14 students
  • % Students of Color: 33%
  • View Hays County, TX School Trends
Quick Facts (26-27)

  • # Private Schools: 15
  • # Students Served: 4,568
  • Average Tuition: $14,396
  • % Students on Financial Aid: 30%
  • Acceptance Rate: 83%
  • Average Class Size: 14 students
  • % Students of Color: 33%
  • View Hays County, TX School Trends
Top Ranked Hays County Private Schools (2026-27)

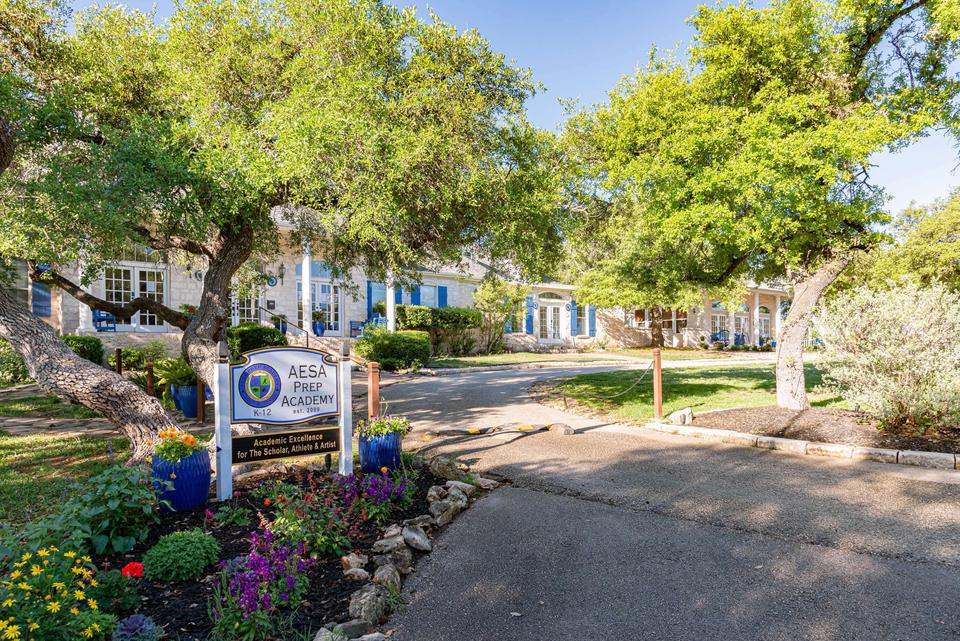
Aesa Prep Academy Photo
Gr: K-12 | 207 students
Avg. class size: 9 students
Sports: 9 | Extracurriculars: 25
14101 Canonade
Austin, TX 78737
(512) 409-1984
(1)
Austin Waldorf School Photo
Gr: PK-12 | 421 students
Avg. class size: 28 students
Sports: 8 | Extracurriculars: 3
Specialized Curriculum
8700 South View Road
Austin, TX 78737
(512) 288-5942
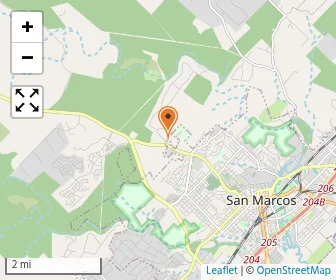
Map of Godfrey Learning Academy
Gr: PK-8 | 26 students
Avg. class size: 6 students
20075 San Marcos Hwy
San Marcos, TX 78640
(678) 814-5042
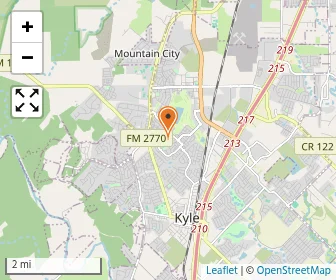
Map of Hill Country Christian School Of San Marcos
Gr: PK-12 | 1,557 students
Christian
1401 Davis Ln
San Marcos, TX 78666
(512) 353-8976
(2)
Ladybird Montessori School Photo
Gr: PK-9 | 224 students
Extracurriculars: 10
Montessori School
2050 Cole Springs Road
Buda, TX 78610
(512) 295-3636
(5)
San Marcos Academy Photo
Gr: PK-12 | 353 students
Avg. class size: 15 students
Sports: 14 | Extracurriculars: 8
Baptist
2801 Ranch Road 12
San Marcos, TX 78666
(512) 753-8000
Map of San Marcos Center School
Gr: 5-12 | 144 students
Special Education School
120 Bert Brown Street
San Marcos, TX 78666
(512) 396-8500
Map of Santa Cruz Catholic School
Gr: PK-8 | 272 students
Catholic
1100 Main St
Buda, TX 78610
(512) 312-2137
Acton Academy Dripping Springs Photo
Gr: 1-6
Alternative School
1000 Hays Country Acres Rd.
Dripping Springs, TX 78620
(512) 731-5540
Advent Ridge Academy Photo
Gr: PK-10 | 51 students
Avg. class size: 10 students
Sports: 3
Seventh Day Adventist
1523 Old Ranch Road 12
San Marcos, TX 78666
(512) 392-9475
(2)
Appamada School Photo
Gr: K-12 | 77 students
Avg. class size: 12 students
Extracurriculars: 4
Alternative School
26450 Ranch Rd 12
Dripping Springs, TX 78620
(512) 484-4976
Dripping Springs Christian Academy Photo
Gr: NS-12 | 167 students
Avg. class size: 15 students
Sports: 2 | Extracurriculars: 5
Christian
800 W Hwy 290, Bldg C, Ste 100
Dripping Springs, TX 78620
(512) 858-9738
(3)
Map of Rocking Horse Academy
Gr: NS-PK | 237 students
Avg. class size: 15 students
Daycare / Preschool
6022 Mcnaughton
Kyle, TX 78640
(512) 405-3700
(1)
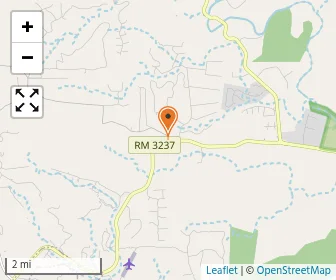
Map of St. St.ephen's Episcopal School
Gr: PK-5 | 98 students
Episcopal
6000 Fm 3237
Wimberley, TX 78676
(512) 847-9857
Map of Wonderland School
Gr: PK-5 | 122 students
Christian
302 Country Estates Dr
San Marcos, TX 78666
(512) 392-9404
[+] Show Closed Private Schools in Hays County, Texas

Hays County Private Schools (Closed)

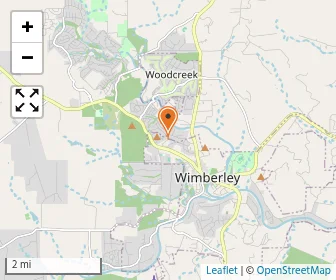
Map of Wimberley Montessori
Gr: PK-6 | 77 students
Avg. class size: 20 students
Montessori School
45 La Buena Vista Drive
Wimberley, TX 78676
(512) 847-6055

Overview

Category
This State (TX)
US
# Schools
20 Schools

Showing 2016–2025. Full 11-year historical data available below ↓

Private schools down 1 in Hays County, falling from 20 in 2024 to 19 in 2025.
# Students
4,568 Students
349,970 Students

Showing 2016–2025. Full 11-year historical data available below ↓

Average students up 143 in Hays County private schools, rising from 109 in 2016 to 252 in 2025.
% Average Students of Color
33%
42%

Showing 2016–2025. Full 11-year historical data available below ↓

Students of color up 3 points in Hays County private schools, rising from 30% in 2016 to 33% in 2025.

Academics and Faculty:

# Teachers
358 Teachers
32,485 Teachers
Average Student-Teacher Ratio
13:1
11:1

Showing 2016–2025. Full 11-year historical data available below ↓

Student-teacher ratio up 3 in Hays County private schools, rising from 10:1 in 2018 to 13:1 in 2025.
% Average Faculty w/Advanced Degree
69%
48%
Average Class Size
14 students
14 students
Average Number of AP Courses
8 courses
12 courses
Average SAT score
1137
(Out of 1600)
1231
Average ACT score
23
(Out of 36)
26

Tuition and Acceptance Rate:

Average Yearly Tuition Cost
$14,396
$12,798
Tuition down 26% in Hays County, from $19,335 in 2023 to $14,285 in 2025, while Texas and the U.S. both rose.
Average % on Financial Aid
30%
24%
Financial aid down 2 points in Hays County private schools, from 32% in 2018 to 30% in 2025.
Average Financial Aid Grant
$3,000
$5,661
Average Acceptance Rate
83%
85%
Average Endowment Size
$8 million
$17.87 million

Students by Ethnicity:

0.57
0.71

Showing 2016–2025. Full 11-year historical data available below ↓

Diversity score down 10 points in Hays County private schools, from 0.67 in 2016 to 0.57 in 2025.
# American Indian Students
65 Students
1,094 Students
% American Indian Students
2%
<1%
# Asian Students
45 Students
20,183 Students
% Asian Students
1%
6%
# Hispanic Students
326 Students
53,669 Students
% Hispanic Students
8%
16%

Showing 2016–2025. Full 11-year historical data available below ↓

# Black Students
75 Students
15,719 Students
% Black Students
2%
5%

Showing 2016–2025. Full 11-year historical data available below ↓

Black students down 2 points in Hays County private schools, from 4% in 2016 to 2% in 2025.
# White Students
2,481 Students
137,788 Students
% White Students
58%
40%

Showing 2016–2025. Full 11-year historical data available below ↓

White share up 15 points in Hays County private schools, rising from 44% in 2016 to 59% in 2025.
# Hawaiian Students
6 Students
500 Students
% Hawaiian Students
<1%
<1%
# Others Students
1,252 Students
113,025 Students
% of Others Students
29%
33%

Showing 2016–2025. Full 11-year historical data available below ↓

Other-race share down 8 points in Hays County private schools, from 36% in 2016 to 28% in 2025.
All Ethnic Groups

Extracurriculars and Sports:

Average Number of Extracurriculars
9 extracurriculars
9 extracurriculars
Average Number of Sports
7 sports
8 sports

Frequently Asked Questions

What are the top ranked private schools in Hays County, TX?
The top ranked private schools in Hays County, TX include San Marcos Academy, Austin Waldorf School, and Hill Country Christian School Of San Marcos.
How many private schools are located in Hays County?
15 private schools are located in Hays County.
How diverse are private schools in Hays County?
Hays County private schools are approximately 33% minority students, which is lower than the Texas private school average of 42%.
What percentage of students in Hays County go to private school?
9% of all K-12 students in Hays County are educated in private schools (compared to the TX state average of 6%).
What percentage of private schools are religiously affiliated in Hays County?
40% of private schools in Hays County are religiously affiliated (most commonly Christian and Seventh Day Adventist).
Which private schools in Hays County are often viewed compared to one another?

Recent Articles

When a Private School Changes Head of School
A private school leadership change can raise important questions. Learn how to evaluate head of school transitions, identify warning signs, and protect your child's educational experience before enrolling confidently.
Private School Financial Aid Renewal: Could Awards Shrink?
Could your private school financial aid shrink next year? Learn why awards change, how income and school budgets affect renewal, and what parents can do to protect affordability long-term.
Need-Blind vs. Need-Aware Private School Admissions
Understand how need-blind and need-aware private school admissions affect acceptance decisions, financial aid eligibility, and affordability, with practical guidance to help parents compare schools, ask questions, and plan confidently ahead.

Filter Schools

School Level
Must Offer Grade
Show more
Gender
School Focus
Religious Affiliation
ADD/ADHD Support
Summer Program

Quick Links