Jefferson County Private Schools

For the 2026-27 school year, there are 14 private schools serving 2,578 students in Jefferson County, TX (there are 75 public schools, serving 41,825 public students). 6% of all K-12 students are educated in private schools (compared to the TX state average of 6%).
The average acceptance rate is 93%, which is higher than the Texas private school average acceptance rate of 85%.
79% of private schools in Jefferson County, TX are religiously affiliated (most commonly Catholic and Christian).

Quick Facts (26-27)

  • # Private Schools: 14
  • # Students Served: 2,578
  • Average Tuition: $9,530
  • % Students on Financial Aid: 30%
  • Average Class Size: 16 students
  • % Students of Color: 42%
  • View Jefferson County, TX School Trends
Quick Facts (26-27)

  • # Private Schools: 14
  • # Students Served: 2,578
  • Average Tuition: $9,530
  • % Students on Financial Aid: 30%
  • Average Class Size: 16 students
  • % Students of Color: 42%
  • View Jefferson County, TX School Trends
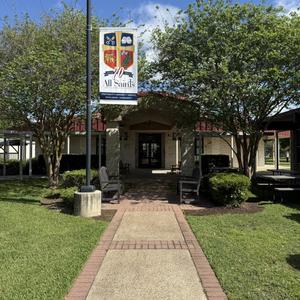
Top Ranked Jefferson County Private Schools (2026-27)

St. Anne Catholic School Photo
Gr: K-8 | 584 students
Avg. class size: 20 students
Sports: 10 | Extracurriculars: 5
Catholic
375 North 11th Street
Beaumont, TX 77702
(409) 832-5939
All Saints Episcopal School Photo
Gr: PK-8 | 400 students
Avg. class size: 20 students
Sports: 10 | Extracurriculars: 11
Episcopal
4108 Delaware Street
Beaumont, TX 77706
(409) 892-1755
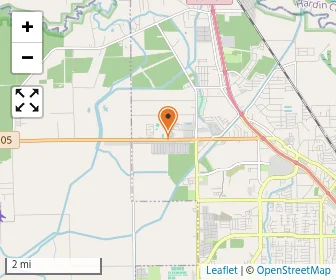
Map of Legacy Christian Academy
Gr: PK-12 | 390 students
Sports: 10 | Extracurriculars: 9
Christian
8200 Highway 105
Beaumont, TX 77713
(409) 924-0500
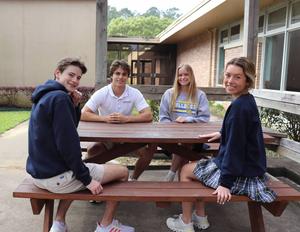
Monsignor Kelly Catholic School Photo
Gr: 9-12 | 303 students
Avg. class size: 15 students
Sports: 12 | Extracurriculars: 50
Catholic
5950 Kelly Dr
Beaumont, TX 77707
(409) 866-2351
(1)
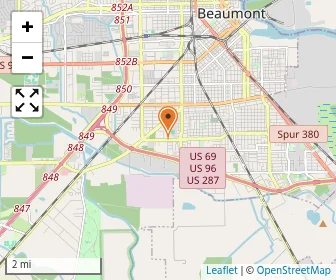
Map of Our Mother Of Mercy Catholic School
Gr: PK-5 | 74 students
Avg. class size: 8 students
Extracurriculars: 7
Catholic
3390 Sarah St
Beaumont, TX 77705
(409) 842-5534
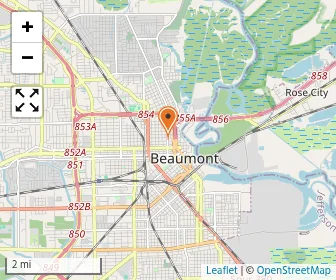
Map of Rise Hybrid Private Academy Texas
Gr: PK-12
706 Magnolia Street
Beaumont, TX 77701
(346) 296-0912
St. Catherine Of Siena School Photo
Gr: PK-8 | 139 students
Avg. class size: 15 students
Sports: 6 | Extracurriculars: 2
Catholic
3840 Woodrow Dr
Port Arthur, TX 77642
(409) 962-3011
Map of The Anchor Early Learning Center
Gr: PK-K | 84 students
Christian
6655 Hwy 105
Beaumont, TX 77708
(409) 899-3947
Map of Cathedral Christian School
Gr: K-6 | 126 students
Avg. class size: 15 students
Sports: 7
Assembly of God
2350 Eastex Freeway
Beaumont, TX 77703
(409) 892-1503
Map of The Montessori School On 11th Street
Gr: PK-K | 33 students
Montessori School
2510c N 11th St
Beaumont, TX 77703
(409) 899-5002
(1)
Map of St. Anthony Cathedral Basilica School
Gr: PK-8 | 214 students
Avg. class size: 20 students
Catholic
850 Forsythe Street
Beaumont, TX 77701
(409) 832-3486
(3)
Map of The School Of Montessori
Gr: PK-K | 34 students
Montessori School
1503 S 16th St
Nederland, TX 77627
(409) 727-5444
Map of Solid Rock Christian Academy
Gr: 2-12 | 105 students
Alternative School (Christian)
155 Ihio N Ste 2
Beaumont, TX 77707
(409) 338-5663
(1)
Map of Val Verde Christian Academy
Gr: PK-12 | 92 students
Baptist
3900 Cleveland Ave
Groves, TX 77619
(409) 962-8822
[+] Show Closed Private Schools in Jefferson County, Texas

Jefferson County Private Schools (Closed)

Map of Living Waters Christian Academy
Gr: 2-12 | 149 students
Specialized Curriculum (Christian)
Po Box 7820
Beaumont, TX 77726
(409) 866-7033
Map of Ridgewood Christian School
Gr: PK-12 | 78 students
Baptist
6920 Memorial Blvd
Port Arthur, TX 77642
(409) 729-6000
Map of Sycamore Elementary Preschool
Gr: K-11 | 19 students
1495 S Highway 69
Nederland, TX 77627
(409) 722-2943
Map of Triangle Adventist Christian School
Gr: PK-8 | 10 students
Seventh Day Adventist
2701 Parkway Dr
Groves, TX 77619
(409) 963-3806

Overview

Category
This State (TX)
US
# Schools
14 Schools

Showing 2016–2025. Full 11-year historical data available below ↓

Private schools held steady in Jefferson County, staying near 13 from 2016 to 2025 and ending at 13 after a brief dip to 12 in 2022.
# Students
2,578 Students
349,935 Students

Showing 2016–2025. Full 11-year historical data available below ↓

Private school size rose 5 students in Jefferson County, from 184 in 2016 to 189 in 2025.
% Average Students of Color
42%
42%

Showing 2016–2025. Full 11-year historical data available below ↓

Students of color up 10 points in Jefferson County private schools, rising from 33% in 2016 to 43% in 2025.

Academics and Faculty:

# Teachers
238 Teachers
32,485 Teachers
Average Student-Teacher Ratio
11:1
11:1

Showing 2016–2025. Full 11-year historical data available below ↓

Student-teacher ratio down 1 in Jefferson County, from 11:1 in 2016 to 10:1 in 2025.
% Average Faculty w/Advanced Degree
26%
48%
Average Class Size
16 students
14 students
Average Number of AP Courses
12 courses
12 courses
Average SAT score
1150
(Out of 1600)
1231
Average ACT score
24
(Out of 36)
26

Tuition and Acceptance Rate:

Average Yearly Tuition Cost
$9,530
$12,796
Average % on Financial Aid
30%
24%
Average Financial Aid Grant
$2,375
$5,588
Average Acceptance Rate
93%
85%
Average Endowment Size
$5 million
$17.58 million

Students by Ethnicity:

0.71
0.71

Showing 2016–2025. Full 11-year historical data available below ↓

Diversity score up 10 points in Jefferson County private schools, rising from 0.61 in 2016 to 0.71 in 2025.
# American Indian Students
8 Students
1,094 Students
% American Indian Students
<1%
<1%
# Asian Students
148 Students
20,183 Students
% Asian Students
6%
6%

Showing 2016–2025. Full 11-year historical data available below ↓

Asian enrollment steady at 6% in Jefferson County private schools from 2023 to 2025, after a brief 7% peak in 2022.
# Hispanic Students
258 Students
53,669 Students
% Hispanic Students
10%
16%

Showing 2016–2025. Full 11-year historical data available below ↓

Hispanic share up 3 points in Jefferson County private schools, rising from 7% in 2016 to 10% in 2025.
# Black Students
441 Students
15,719 Students
% Black Students
17%
5%

Showing 2016–2025. Full 11-year historical data available below ↓

Black students up 4 points in Jefferson County private schools, rising from 14% in 2016 to 18% in 2025.
# White Students
1,153 Students
137,788 Students
% White Students
46%
40%

Showing 2016–2025. Full 11-year historical data available below ↓

White share down 12 points in Jefferson County private schools, from 59% in 2016 to 47% in 2025.
# Hawaiian Students
1 Student
500 Students
% Hawaiian Students
<1%
<1%
# Others Students
521 Students
112,995 Students
% of Others Students
21%
33%

Showing 2016–2025. Full 11-year historical data available below ↓

Other-race students up 5 points in Jefferson County private schools, rising from 14% in 2016 to 19% in 2025.
All Ethnic Groups

Extracurriculars and Sports:

Average Number of Extracurriculars
14 extracurriculars
9 extracurriculars
Average Number of Sports
9 sports
8 sports

Frequently Asked Questions

What are the top ranked private schools in Jefferson County, TX?
The top ranked private schools in Jefferson County, TX include Legacy Christian Academy, Our Mother Of Mercy Catholic School, and St. Anne Catholic School.
How many private schools are located in Jefferson County?
14 private schools are located in Jefferson County.
How diverse are private schools in Jefferson County?
Jefferson County private schools are approximately 42% minority students, which is same as the Texas private school average of 42%.
What percentage of students in Jefferson County go to private school?
6% of all K-12 students in Jefferson County are educated in private schools (compared to the TX state average of 6%).
What percentage of private schools are religiously affiliated in Jefferson County?
79% of private schools in Jefferson County are religiously affiliated (most commonly Catholic and Christian).
Which private schools in Jefferson County are often viewed compared to one another?

Recent Articles

When a Private School Changes Head of School
A private school leadership change can raise important questions. Learn how to evaluate head of school transitions, identify warning signs, and protect your child's educational experience before enrolling confidently.
Private School Financial Aid Renewal: Could Awards Shrink?
Could your private school financial aid shrink next year? Learn why awards change, how income and school budgets affect renewal, and what parents can do to protect affordability long-term.
Need-Blind vs. Need-Aware Private School Admissions
Understand how need-blind and need-aware private school admissions affect acceptance decisions, financial aid eligibility, and affordability, with practical guidance to help parents compare schools, ask questions, and plan confidently ahead.

Filter Schools

School Level
Must Offer Grade
Show more
Gender
School Focus
Religious Affiliation
ADD/ADHD Support
Summer Program

Quick Links