Albemarle County Private Schools

For the 2026-27 school year, there are 15 private schools serving 2,347 students in Albemarle County, VA (there are 23 public schools, serving 12,473 public students). 16% of all K-12 students are educated in private schools (compared to the VA state average of 11%).
The average acceptance rate is 72%, which is lower than the Virginia private school average acceptance rate of 82%.
12% of private schools in Albemarle County, VA are religiously affiliated (most commonly Catholic and Christian).

Quick Facts (26-27)

  • # Private Schools: 15
  • # Students Served: 2,347
  • % Students on Financial Aid: 40%
  • Acceptance Rate: 72%
  • Average Class Size: 13 students
  • % Students of Color: 19%
  • View Albemarle County, VA School Trends
Quick Facts (26-27)

  • # Private Schools: 15
  • # Students Served: 2,347
  • % Students on Financial Aid: 40%
  • Acceptance Rate: 72%
  • Average Class Size: 13 students
  • % Students of Color: 19%
  • View Albemarle County, VA School Trends
Top Ranked Albemarle County Private Schools (2026-27)

Charlottesville Catholic School Photo
Gr: PK-8 | 370 students
Avg. class size: 20 students
Sports: 6 | Extracurriculars: 7
Catholic
1205 Pen Park Rd
Charlottesville, VA 22901
(434) 964-0400
Keswick School Photo
Gr: 4-12 | 35 students
Avg. class size: 7 students
Sports: 8 | Extracurriculars: 10
All-boys | Special Education School
500 Little Keswick Ln
Keswick, VA 22947
(434) 295-0457
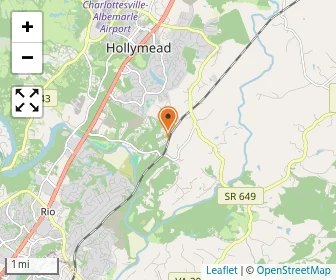
Map of Mountaintop Montessori School
Gr: PK-8 | 260 students
Avg. class size: 23 students
Montessori School
440 Pinnacle Pl
Charlottesville, VA 22911
(434) 979-8886
Regents School of Charlottesville Photo
Gr: K-12 | 286 students
Avg. class size: 14 students
Sports: 8 | Extracurriculars: 8
Specialized Curriculum (Christian)
2010 Coram Deo Drive
Charlottesville, VA 22903
(434) 293-0633
(10)
St. Anne's-belfield School Photo
Gr: PK-12 | 798 students
Avg. class size: 14 students
Sports: 14
2132 Ivy Road
Charlottesville, VA 22903
(434) 296-5106
(1)
Map of Albemarle Montessori Children's Community
Gr: PK-5 | 74 students
Montessori School
1550 Insurance Ln
Charlottesville, VA 22911
(434) 244-2471
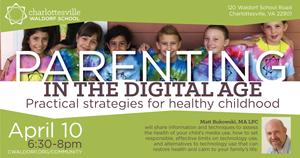
Charlottesville Waldorf School Photo
Gr: PK-8 | 115 students
Avg. class size: 10 students
Sports: 5
Specialized Curriculum
120 Waldorf Sshool Road
Charlottesville, VA 22901
(434) 973-4946
(5)
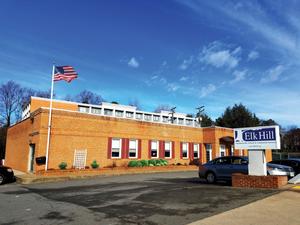
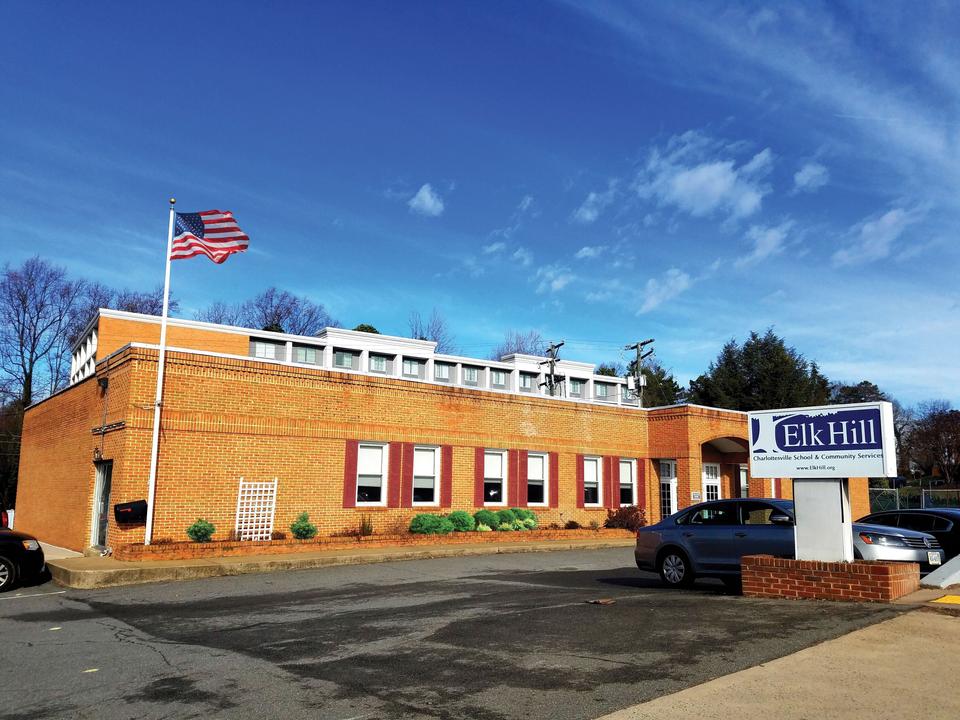
Elk Hill Charlottesville School Photo
Gr: 4-12 | 28 students
Special Education School
1819 Emmet St N
Charlottesville, VA 22901
(434) 220-7198
Map of Foster Forge Farm School
Gr: 5-8
Avg. class size: 6 students
Specialized Curriculum
PO Box 5038
Charlottesville, VA 22905
(434) 282-5804
Map of Free Union Country School
Gr: PK-5 | 93 students
Avg. class size: 10 students
4220 Free Union Road
Free Union, VA 22940
(434) 978-1700
Map of Frost Montessori School
Gr: PK-K | 90 students
Montessori School
1553 Delphi Dr
Charlottesville, VA 22911
(434) 979-5223
Map of Generations Montessori School Of Charlottesville
Gr: PK-K | 35 students
Montessori School
1975 Franklin Dr
Charlottesville, VA 22911
(434) 422-8161
Map of Hillsdale KinderCare
Gr: NS-PK
Daycare / Preschool
601 Hillsdale Dr
Charlottesville, VA 22901
(434) 973-2777
Map of Keys Academy - Charlottesville
Gr: 1-11 | 27 students
Special Education School
3020 Fontaine Ave
Charlottesville, VA 22903
(434) 995-5810
Map of Riverbend KinderCare
Gr: NS-PK
Daycare / Preschool
201 Riverbend Dr
Charlottesville, VA 22911
(434) 295-8569

Overview

Category
This State (VA)
US
# Schools
17 Schools

Showing 2016–2025. View full 11-year historical data

Private schools fell sharply from 22 in 2016 to 18 in 2025, after dipping to 10 in 2018 and then recovering to 18.
# Students
2,347 Students
152,607 Students

Showing 2016–2025. View full 11-year historical data

Average students up 20 in Albemarle County private schools, rising from 146 in 2016 to 166 in 2025.
% Average Students of Color
19%
31%

Showing 2016–2025. View full 11-year historical data

Academics and Faculty:

# Teachers
251 Teachers
14,411 Teachers
Average Student-Teacher Ratio
10:1
11:1

Showing 2016–2025. View full 11-year historical data

% Average Faculty w/Advanced Degree
49%
55%
Average Class Size
13 students
14 students
Class size now 13 in Albemarle County private schools, down from 14 in 2016 and smaller than Virginia's 14 and the U.S. 15.
Average Number of AP Courses
9 courses
12 courses
Average SAT score
1306
(Out of 1600)
1229
Average ACT score
30
(Out of 36)
27

Tuition and Acceptance Rate:

Average Yearly Tuition Cost
$26,010
$15,972
Average % on Financial Aid
40%
30%
Average Financial Aid Grant
$12,483
$9,451
Average Acceptance Rate
72%
82%

Students by Ethnicity:

0.58
0.65

Showing 2016–2025. View full 11-year historical data

# American Indian Students
3 Students
492 Students
% American Indian Students
<1%
<1%
# Asian Students
160 Students
8,941 Students
% Asian Students
8%
6%

Showing 2016–2025. View full 11-year historical data

# Hispanic Students
64 Students
6,674 Students
% Hispanic Students
3%
5%

Showing 2016–2025. View full 11-year historical data

Hispanic share now 3% in Albemarle County private schools, up from 2% in 2016 and still below Virginia's 4% and the U.S.'s 9%.
# Black Students
125 Students
11,974 Students
% Black Students
6%
8%

Showing 2016–2025. View full 11-year historical data

# White Students
1,256 Students
73,416 Students
% White Students
61%
49%

Showing 2016–2025. View full 11-year historical data

# Hawaiian Students
3 Students
370 Students
% Hawaiian Students
<1%
<1%
# Others Students
456 Students
47,683 Students
% of Others Students
22%
32%

Showing 2016–2025. View full 11-year historical data

All Ethnic Groups

Extracurriculars and Sports:

Average Number of Extracurriculars
8 extracurriculars
10 extracurriculars
Average Number of Sports
8 sports
7 sports

Frequently Asked Questions

What are the top ranked private schools in Albemarle County, VA?
The top ranked private schools in Albemarle County, VA include St. Anne's-belfield School, Mountaintop Montessori School, and Charlottesville Catholic School.
How many private schools are located in Albemarle County?
15 private schools are located in Albemarle County.
How diverse are private schools in Albemarle County?
Albemarle County private schools are approximately 19% minority students, which is lower than the Virginia private school average of 31%.
What percentage of students in Albemarle County go to private school?
16% of all K-12 students in Albemarle County are educated in private schools (compared to the VA state average of 11%).
What percentage of private schools are religiously affiliated in Albemarle County?
12% of private schools in Albemarle County are religiously affiliated (most commonly Catholic and Christian).
Which private schools in Albemarle County are often viewed compared to one another?

Recent Articles

Can Private Schools Raise Fees After You Sign?
Can private schools increase mandatory fees after enrollment contracts are signed? Learn how contract terms, fee disclosures, state laws, and parent rights affect unexpected charges and available options.
Financial Aid When a Sibling Graduates Private School
Learn how private school financial aid may change when an older sibling graduates, including revised family contributions, sibling discounts, college expenses, renewal decisions, and practical steps to protect affordability.
Private School Expansion: Preserving School Culture
Discover how growing private schools can expand enrollment while preserving small classes, personal attention, strong relationships, and school culture, plus essential questions parents should ask before choosing a school.

Filter Schools

School Level
Must Offer Grade
Show more
Gender
School Focus
Religious Affiliation
ADD/ADHD Support
Summer Program

Quick Links