
Merced County Private Schools

For the 2026-27 school year, there are 16 private schools serving 2,118 students in Merced County, CA (there are 116 public schools, serving 59,546 public students). 3% of all K-12 students are educated in private schools (compared to the CA state average of 10%).
The average acceptance rate is 96%, which is higher than the California private school average acceptance rate of 83%.
94% of private schools in Merced County, CA are religiously affiliated (most commonly Christian and Catholic).

Quick Facts (26-27)

  • # Private Schools: 16
  • # Students Served: 2,118
  • Average Tuition: $8,158
  • Acceptance Rate: 96%
  • Average Class Size: 16 students
  • % Students of Color: 43%
  • View Merced County, CA School Trends

Quick Facts (26-27)

  • # Private Schools: 16
  • # Students Served: 2,118
  • Average Tuition: $8,158
  • Acceptance Rate: 96%
  • Average Class Size: 16 students
  • % Students of Color: 43%
  • View Merced County, CA School Trends

Top Ranked Merced County Private Schools (2026-27)

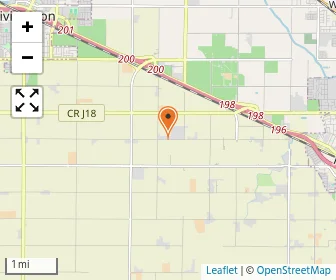
Map of Los Banos Adventist School
Gr: K-8 | 32 students
Seventh Day Adventist
404 Overland Avenue
Los Banos, CA 93635
(209) 827-4624
Our Lady Of Fatima School Photo
Gr: PK-8 | 206 students
Catholic
1625 Center Avenue
Los Banos, CA 93635
(209) 826-2709
Map of Our Lady Of Mercy School
Gr: PK-8 | 360 students
Catholic
1400 E 27th St
Merced, CA 95340
(209) 722-7496
Map of St. Anthony School
Gr: PK-8 | 121 students
Catholic
1801 Winton Way
Atwater, CA 95301
(209) 358-3341
Stone Ridge Christian Elementary Photo
Gr: PK-5 | 238 students
Avg. class size: 20 students
Sports: 1 | Extracurriculars: 1
Christian
2738 Dan Ward Rd
Merced, CA 95348
(209) 386-0322
Stone Ridge Christian School Photo
Gr: PK-12 | 320 students
Avg. class size: 15 students
Sports: 12
Christian
2769 Dan Ward Road
Merced, CA 95348
(209) 386-0322
(1)
Map of Fruitland Christian Preschool
Gr: NS-6 | 116 students
Avg. class size: 12 students
Daycare / Preschool (Church of God)
2100 Fruitland Ave
Atwater, CA 95301
(209) 358-7981
(3)
Map of Grace Mennonite School
Gr: K-10 | 104 students
Mennonite
7200 Central Ave.
Winton, CA 95388
(209) 358-0452
Map of Harest Christian School
Gr: PK-12 | 45 students
Christian
161 E 16th St.
Merced, CA 95340
(209) 384-0770
Map of Highland Preparatory School
Gr: K-12 | 103 students
Alternative School (Christian)
1292 Estes Dr
Le Grand, CA 95333
(805) 264-4161
Map of Landmark Christian School
Gr: K-12 | 43 students
1927 Olive Ave
Atwater, CA 95301
(209) 358-0790
Map of Longview Mennonite School
Gr: K-10 | 53 students
Mennonite
12725 Longview Ave
Livingston, CA 95334
(209) 394-7912
Map of Merced Montessori School
Gr: PK-K | 65 students
Daycare / Preschool
436 W 21st St
Merced, CA 95340
(209) 722-9823
Map of Our Lady Of Miracles
Gr: PK-8 | 140 students
Catholic
370 Linden Ave
Gustine, CA 95322
(209) 854-0017
Map of Principal
Gr: K-12 | 29 students
Assembly of God
1683 5th St
Atwater, CA 95301
(209) 357-5691
St. Paul School Photo
Gr: PK-6 | 143 students
Avg. class size: 15 students
Sports: 1
Lutheran Church Missouri Synod
2916 Mckee Road
Merced, CA 95340
(209) 383-3302
[+] Show Closed Private Schools in Merced County, California

Merced County Private Schools (Closed)

Map of Acts Christian School
Gr: PK-12 | 50 students
Pentecostal
2745 E Hwy 140
Merced, CA 95340
(209) 722-6331
Map of Planada Christian Academy
Gr: 1-12 | 11 students
9182 E Stanford Po Box 1047
Planada, CA 95365
(209) 382-1009
Map of St. Luke's Episcopal School
Gr: PK-5 | 66 students
Avg. class size: 12 students
Episcopal
350 W Yosemite Avenue
Merced, CA 95348
(209) 723-3907

Overview

Category
This State (CA)
US
# Schools
16 Schools

Showing 2016–2025. Full 11-year historical data available below ↓

Private schools down 3 in Merced County, falling from 19 in 2016 to 16 in 2025.
# Students
2,118 Students
659,615 Students

Showing 2016–2025. Full 11-year historical data available below ↓

Average students up 29 in Merced County private schools, from 104 in 2016 to 133 in 2025.
% Average Students of Color
43%
52%

Showing 2016–2025. Full 11-year historical data available below ↓

Students of color up 14 points in Merced County private schools, rising from 29% in 2016 to 43% in 2025.

Academics and Faculty:

# Teachers
137 Teachers
55,836 Teachers
Average Student-Teacher Ratio
15:1
12:1

Showing 2016–2025. Full 11-year historical data available below ↓

Ratio up 2:1 in Merced County, from 13:1 in 2016 to 15:1 in 2025, while California stayed at 12:1 and the U.S. at 11:1.
% Average Faculty w/Advanced Degree
77%
60%
Average Class Size
16 students
17 students
Average Number of AP Courses
10 courses
15 courses

Tuition and Acceptance Rate:

Average Yearly Tuition Cost
$8,158
$17,625
Average % on Financial Aid
30%
29%
Average Acceptance Rate
96%
83%

Students by Ethnicity:

0.70
0.74

Showing 2016–2025. Full 11-year historical data available below ↓

Diversity score up 10 points in Merced County private schools, rising from 0.60 in 2016 to 0.70 in 2025.
# American Indian Students
7 Students
3,574 Students
% American Indian Students
<1%
1%
# Asian Students
108 Students
71,777 Students
% Asian Students
5%
11%

Showing 2016–2025. Full 11-year historical data available below ↓

Asian share up 1 point in Merced County private schools, from 5% in 2016 to 6% in 2025, while California rose to 11%.
# Hispanic Students
485 Students
104,405 Students
% Hispanic Students
23%
16%

Showing 2016–2025. Full 11-year historical data available below ↓

Hispanic share up 7 points in Merced County private schools, rising from 16% in 2016 to 23% in 2025.
# Black Students
26 Students
30,221 Students
% Black Students
1%
5%

Showing 2016–2025. Full 11-year historical data available below ↓

Black student share down 1 point in Merced County private schools, from 2% in 2016 to 1% in 2025.
# White Students
811 Students
235,730 Students
% White Students
38%
37%

Showing 2016–2025. Full 11-year historical data available below ↓

White students down 21 points in Merced County private schools, from 59% in 2016 to 38% in 2025.
# Hawaiian Students
9 Students
5,499 Students
% Hawaiian Students
1%
1%
# Others Students
679 Students
188,740 Students
% of Others Students
32%
29%

Showing 2016–2025. Full 11-year historical data available below ↓

Other-race share up 14 points in Merced County private schools, rising from 18% in 2016 to 32% in 2025.
All Ethnic Groups

Extracurriculars and Sports:

Average Number of Extracurriculars
1 extracurriculars
9 extracurriculars
Average Number of Sports
5 sports
7 sports

Frequently Asked Questions

What are the top ranked private schools in Merced County, CA?
The top ranked private schools in Merced County, CA include St. Anthony School, Our Lady Of Fatima School, and Los Banos Adventist School.
How many private schools are located in Merced County?
16 private schools are located in Merced County.
How diverse are private schools in Merced County?
Merced County private schools are approximately 43% minority students, which is lower than the California private school average of 52%.
What percentage of students in Merced County go to private school?
3% of all K-12 students in Merced County are educated in private schools (compared to the CA state average of 10%).
What percentage of private schools are religiously affiliated in Merced County?
94% of private schools in Merced County are religiously affiliated (most commonly Christian and Catholic).
Which private schools in Merced County are often viewed compared to one another?

Recent Articles

When a Private School Changes Head of School
A private school leadership change can raise important questions. Learn how to evaluate head of school transitions, identify warning signs, and protect your child's educational experience before enrolling confidently.
Private School Financial Aid Renewal: Could Awards Shrink?
Could your private school financial aid shrink next year? Learn why awards change, how income and school budgets affect renewal, and what parents can do to protect affordability long-term.
Need-Blind vs. Need-Aware Private School Admissions
Understand how need-blind and need-aware private school admissions affect acceptance decisions, financial aid eligibility, and affordability, with practical guidance to help parents compare schools, ask questions, and plan confidently ahead.

Filter Schools

School Level
Must Offer Grade
Show more
Gender
School Focus
Religious Affiliation
ADD/ADHD Support
Summer Program

Quick Links