Livingston County Private Schools

For the 2026-27 school year, there are 14 private schools serving 1,995 students in Livingston County, MI (there are 47 public schools, serving 24,020 public students). 8% of all K-12 students are educated in private schools (compared to the MI state average of 10%).
The average acceptance rate is 96%, which is higher than the Michigan private school average acceptance rate of 91%.
71% of private schools in Livingston County, MI are religiously affiliated (most commonly Catholic and Lutheran Church Missouri Synod).

Quick Facts (26-27)

  • # Private Schools: 14
  • # Students Served: 1,995
  • Average Tuition: $7,019
  • % Students on Financial Aid: 10%
  • Acceptance Rate: 96%
  • Average Class Size: 18 students
  • % Students of Color: 5%
  • View Livingston County, MI School Trends
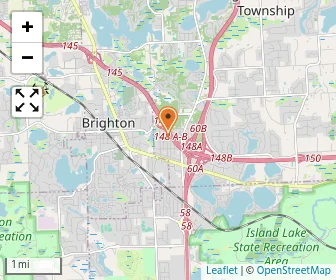
Quick Facts (26-27)

  • # Private Schools: 14
  • # Students Served: 1,995
  • Average Tuition: $7,019
  • % Students on Financial Aid: 10%
  • Acceptance Rate: 96%
  • Average Class Size: 18 students
  • % Students of Color: 5%
  • View Livingston County, MI School Trends
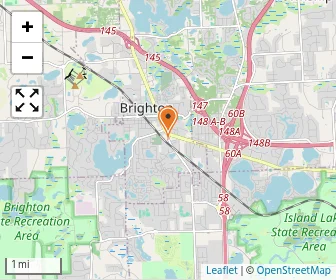
Top Ranked Livingston County Private Schools (2026-27)

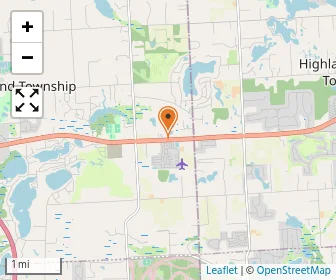
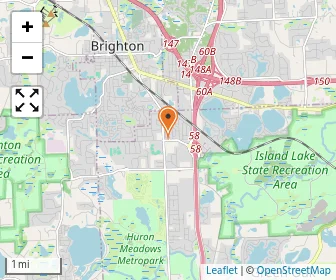
Map of Brighton Montessori
Gr: PK-K | 91 students
Montessori School
5291 Ethel St
Brighton, MI 48116
(810) 522-5222
(2)
Map of St. Patrick School
Gr: K-8 | 450 students
Avg. class size: 26 students
Catholic
1001 Orndorf Dr
Brighton, MI 48116
(810) 229-7946
(1)
Map of Shepherd Of The Lakes Lutheran School
Gr: NS-8 | 301 students
Avg. class size: 26 students
Sports: 5 | Extracurriculars: 4
Lutheran Church Missouri Synod
2101 S Hacker Road
Brighton, MI 48114
(810) 227-6473
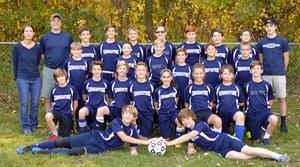
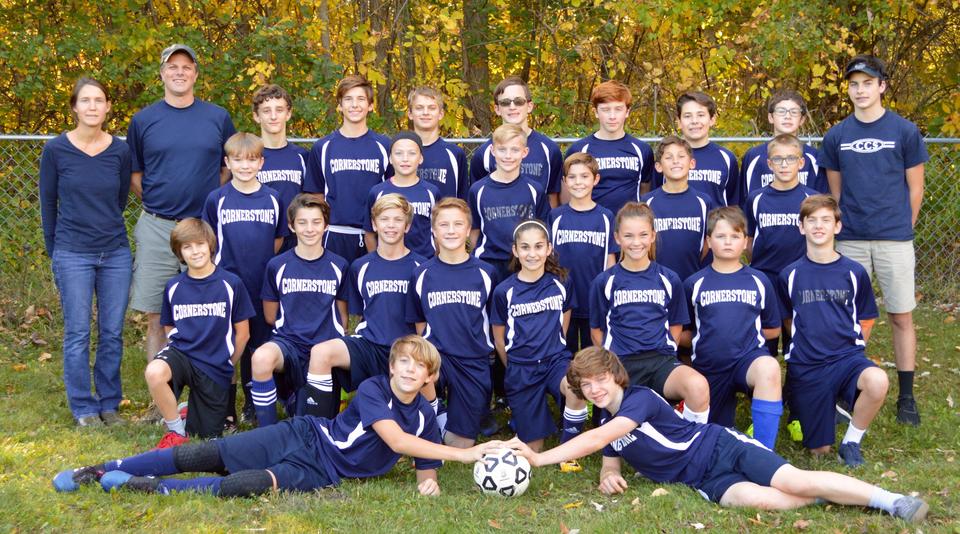
Cornerstone Christian School Photo
Gr: PK-8 | 157 students
Avg. class size: 14 students
Sports: 5 | Extracurriculars: 4
Presbyterian
9455 Hilton Road
Brighton, MI 48114
(810) 494-4040
(8)
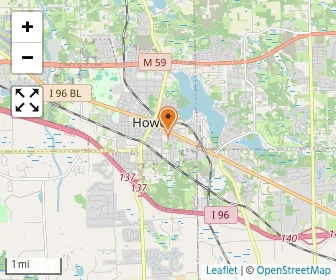
Map of Follow The Child Montessori School
Gr: PK-K | 40 students
Montessori School
985 N Latson Rd
Howell, MI 48843
(517) 545-0919
Map of Holy Spirit Catholic School
Gr: PK-8 | 83 students
Avg. class size: 13 students
Catholic
9565 Musch Road
Brighton, MI 48116
(810) 900-9050
(4)
Map of Howell KinderCare
Gr: NS-PK
Daycare / Preschool
1840 N Latson Rd
Howell, MI 48843
(517) 552-9600
Map of Light Of The World Academy
Gr: NS-6 | 119 students
Avg. class size: 18 students
Extracurriculars: 2
Montessori School (Evangelical Lutheran Church in America (formerly AELC, ALC, or LCA))
1740 E M-36
Pinckney, MI 48169
(734) 878-3301
Livingston Christian Schools Photo
Gr: PK-12 | 237 students
Avg. class size: 20 students
Sports: 6 | Extracurriculars: 2
Christian
7669 Brighton Rd.
Brighton, MI 48116
(810) 900-1200
(2)
Maple Tree Montessori Academy Photo
Gr: NS-8 | 109 students
Avg. class size: 20 students
Extracurriculars: 5
Montessori School
2944 S. Old US Hwy 23
Brighton, MI 48114
(810) 225-8321
Map of Our Savior Evangelical Lutheran School
Gr: PK-8 | 145 students
Avg. class size: 10 students
Sports: 4 | Extracurriculars: 2
Lutheran Church Missouri Synod
13667 West Highland Rd
Hartland, MI 48353
(248) 887-3836
(4)
Map of St. Joseph Catholic School
Gr: PK-8 | 104 students
Avg. class size: 20 students
Sports: 4
Catholic
425 E Washington St
Howell, MI 48843
(517) 546-0090
St. Mary Catholic School Photo
Gr: PK-8 | 139 students
Avg. class size: 15 students
Sports: 3
Catholic
10601 Dexter-pinckney Rd
Pinckney, MI 48169
(734) 878-5616
(2)
Map of Tri-lakes Baptist Christian School
Gr: K-5 | 20 students
Baptist
9100 Lee Road
Brighton, MI 48116
(810) 229-9402
[+] Show Closed Private Schools in Livingston County, Michigan

Livingston County Private Schools (Closed)

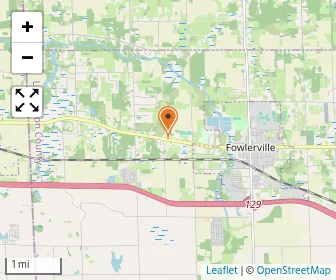
Map of Fowlerville Christian School
Gr: K-12 | 31 students
Montessori School (Baptist)
9430 W Grand River Rd
Fowlerville, MI 48836
(517) 223-9474

Overview

Category
This State (MI)
US
# Schools
14 Schools

Showing 2016–2025. Full 11-year historical data available below ↓

Private schools up 2 in Livingston County, rising from 12 in 2016 to 14 in 2025.
# Students
1,995 Students
146,048 Students

Showing 2016–2025. Full 11-year historical data available below ↓

Average students up 18 in Livingston County private schools, rising from 135 in 2016 to 153 in 2025.
% Average Students of Color
5%
19%

Showing 2016–2025. Full 11-year historical data available below ↓

Students of color up 3 points in Livingston County private schools, rising from 2% in 2016 to 5% in 2025.

Academics and Faculty:

# Teachers
144 Teachers
11,540 Teachers
Average Student-Teacher Ratio
14:1
13:1

Showing 2016–2025. Full 11-year historical data available below ↓

Student-teacher ratio rose 2 in Livingston County private schools, from 12:1 in 2020 to 14:1 in 2025.
% Average Faculty w/Advanced Degree
62%
56%

Showing 2016–2025. Full 11-year historical data available below ↓

Advanced degrees down 6 points in Livingston County private schools, from 68% in 2016 to 62% in 2025.
Average Class Size
18 students
17 students

Showing 2016–2025. Full 11-year historical data available below ↓

Tuition and Acceptance Rate:

Average Yearly Tuition Cost
$7,019
$8,963

Showing 2016–2025. Full 11-year historical data available below ↓

Tuition up 15% in Livingston County, from $6,088 in 2016 to $7,019 in 2025.
Average % on Financial Aid
10%
33%

Showing 2016–2025. Full 11-year historical data available below ↓

Average Financial Aid Grant
$1,860
$3,389
Grant aid up 500 dollars in Livingston County, rising from $1,360 in 2017 to $1,860 in 2025.
Average Acceptance Rate
96%
91%
Average Endowment Size
$5 million
$27.11 million

Students by Ethnicity:

0.48
0.52

Showing 2016–2025. Full 11-year historical data available below ↓

Diversity score up 16 points in Livingston County private schools, rising from 0.32 in 2016 to 0.48 in 2025.
# American Indian Students
2 Students
464 Students
% American Indian Students
<1%
<1%
# Asian Students
17 Students
4,112 Students
% Asian Students
1%
3%
# Hispanic Students
29 Students
5,537 Students
% Hispanic Students
2%
4%

Showing 2016–2025. Full 11-year historical data available below ↓

# Black Students
8 Students
6,857 Students
% Black Students
<1%
5%
# White Students
1,212 Students
98,052 Students
% White Students
64%
65%

Showing 2016–2025. Full 11-year historical data available below ↓

White enrollment down 17 points in Livingston County private schools, from 81% in 2016 to 64% in 2025.
# Hawaiian Students
0 Students
180 Students
% Hawaiian Students
0%
<1%
# Others Students
619 Students
34,313 Students
% of Others Students
33%
23%

Showing 2016–2025. Full 11-year historical data available below ↓

Other-race share up 16 points in Livingston County private schools, rising from 17% in 2016 to 33% in 2025.
All Ethnic Groups

Extracurriculars and Sports:

Average Number of Extracurriculars
3 extracurriculars
8 extracurriculars
Average Number of Sports
5 sports
7 sports

Frequently Asked Questions

What are the top ranked private schools in Livingston County, MI?
The top ranked private schools in Livingston County, MI include Brighton Montessori, St. Patrick School, and Shepherd Of The Lakes Lutheran School.
How many private schools are located in Livingston County?
14 private schools are located in Livingston County.
How diverse are private schools in Livingston County?
Livingston County private schools are approximately 5% minority students, which is lower than the Michigan private school average of 19%.
What percentage of students in Livingston County go to private school?
8% of all K-12 students in Livingston County are educated in private schools (compared to the MI state average of 10%).
What percentage of private schools are religiously affiliated in Livingston County?
71% of private schools in Livingston County are religiously affiliated (most commonly Catholic and Lutheran Church Missouri Synod).
Which private schools in Livingston County are often viewed compared to one another?

Recent Articles

When a Private School Changes Head of School
A private school leadership change can raise important questions. Learn how to evaluate head of school transitions, identify warning signs, and protect your child's educational experience before enrolling confidently.
Private School Financial Aid Renewal: Could Awards Shrink?
Could your private school financial aid shrink next year? Learn why awards change, how income and school budgets affect renewal, and what parents can do to protect affordability long-term.
Need-Blind vs. Need-Aware Private School Admissions
Understand how need-blind and need-aware private school admissions affect acceptance decisions, financial aid eligibility, and affordability, with practical guidance to help parents compare schools, ask questions, and plan confidently ahead.

Filter Schools

School Level
Must Offer Grade
Show more
Gender
School Focus
Religious Affiliation
ADD/ADHD Support
Summer Program

Quick Links