Cambria County Private Schools

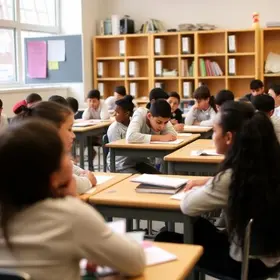
For the 2026-27 school year, there are 14 private schools serving 2,130 students in Cambria County, PA (there are 38 public schools, serving 16,357 public students). 12% of all K-12 students are educated in private schools (compared to the PA state average of 14%).
The average acceptance rate is 90%, which is higher than the Pennsylvania private school average acceptance rate of 86%.
79% of private schools in Cambria County, PA are religiously affiliated (most commonly Catholic and Brethren).

Quick Facts (26-27)

Quick Facts (26-27)

Top Ranked Cambria County Private Schools (2026-27)

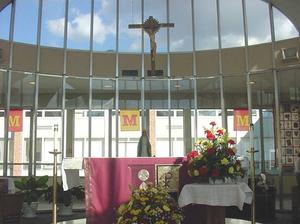
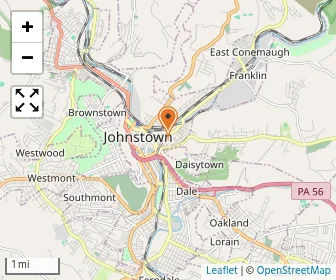
Bishop Mc Cort Catholic High School Photo
Gr: 7-12 | 298 students
Avg. class size: 22 students
Sports: 15 | Extracurriculars: 1
Catholic
25 Osborne Street
Johnstown, PA 15905
(814) 536-8991
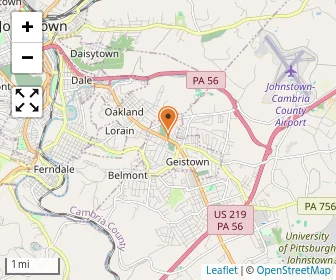
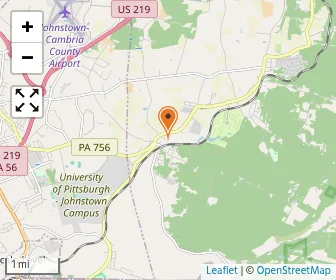
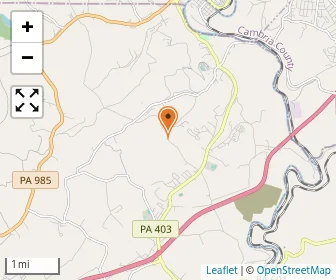
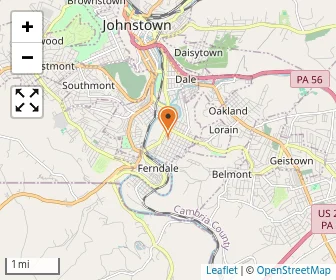
Map of Bishop McCort Catholic Elementary
Gr: PK-6 | 363 students
Catholic
2306 Bedford St
Johnstown, PA 15904
(814) 961-3622
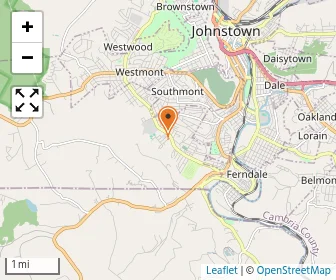
Divine Mercy Catholic Academy,west Campus Photo
Gr: PK-6 | 237 students
Catholic
430 Tioga St
Johnstown, PA 15905
(814) 961-3622
(2)
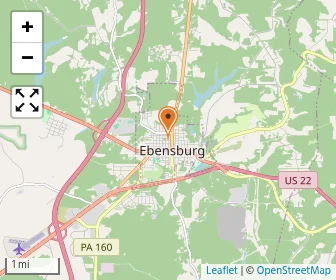
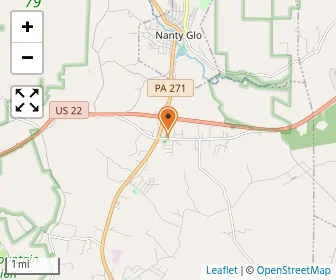
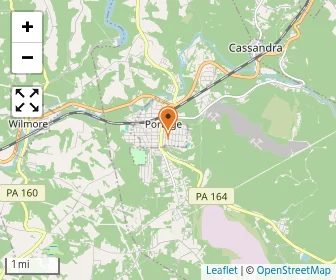
Map of Holy Name Elementary School
Gr: PK-8 | 288 students
Catholic
215 W Horner St
Ebensburg, PA 15931
(814) 472-8817
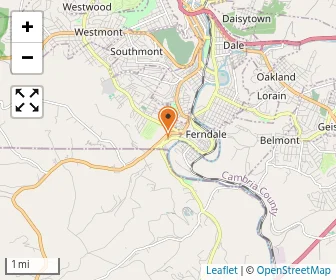
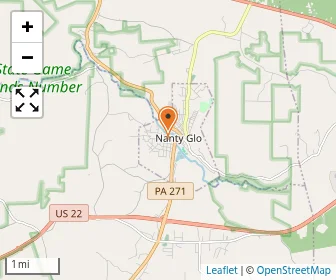
Map of Nicktown Parochial School
Gr: 1-8 | 27 students
Avg. class size: 20 students
Amish
2960 Nolo Rd.
Penn Run, PA 15765
(814) 948-7816
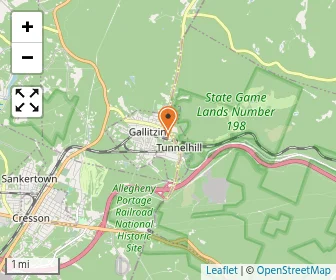
Map of Northern Cambria Catholic School
Gr: PK-8 | 137 students
Avg. class size: 20 students
Catholic
3278 Blue Goose Road
Nicktown, PA 15762
(814) 948-8900
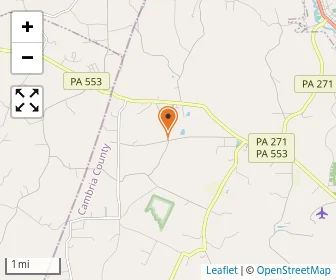
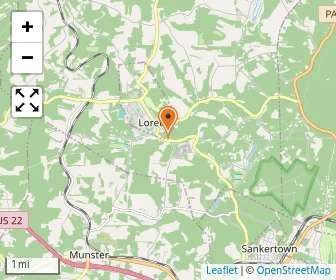
Map of St. Michael School
Gr: K-8 | 90 students
Avg. class size: 10 students
Sports: 9
Catholic
301 Saint Elizabeth St
Loretto, PA 15940
(814) 472-9117
(1)
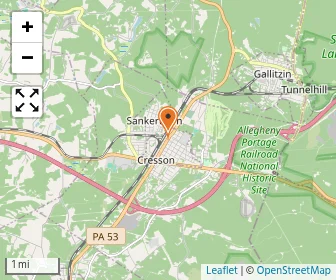
Map of All Saints Catholic School
Gr: PK-8 | 121 students
Catholic
220 Powell Ave
Cresson, PA 16630
(814) 886-7942
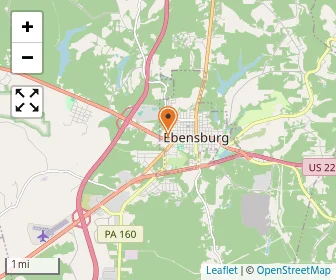
Map of Bishop Carroll Catholic High School
Gr: 9-12 | 162 students
Catholic
728 Ben Franklin Hwy
Ebensburg, PA 15931
(814) 472-7500
Map of Cambria County Christian School
Gr: PK-12 | 89 students
Avg. class size: 9 students
Sports: 2 | Extracurriculars: 1
Brethren
561 Pike Rd
Johnstown, PA 15909
(814) 749-7406
Map of Center For Achievement
Gr: K-5 | 10 students
Special Education School
317 Power St
Johnstown, PA 15906
(814) 361-2414
Map of Pressley Ridge Johnstown
Gr: K | 107 students
Special Education School
445 Schoolhouse Rd
Johnstown, PA 15904
(814) 262-9514
Map of Richland Academy
Gr: PK-K | 92 students
Montessori School
136 Jaycee Dr Suite 50
Johnstown, PA 15904
(814) 292-9201
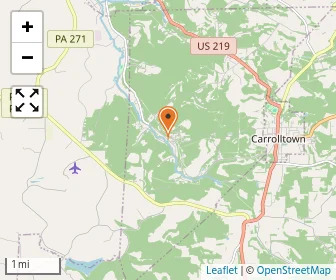
Map of St. Benedict School
Gr: PK-8 | 109 students
Avg. class size: 20 students
Catholic
119 South Church Street
Carrolltown, PA 15722
(814) 344-6512
[+] Show Closed Private Schools in Cambria County, Pennsylvania

Cambria County Private Schools (Closed)

Map of Central Catholic Elementary School
Gr: PK-8 | 108 students
Catholic
751 Railroad Street
Johnstown, PA 15901
(814) 536-1532
Map of Davidsville Christian School
Gr: PK-12 | 56 students
Brethren
197 Pender Rd
Johnstown, PA 15905
(814) 479-2525
Map of Our Lady Of The Sacred Heart School
Gr: PK-K | 31 students
Daycare / Preschool (Catholic)
812 Orchard St
Portage, PA 15946
(814) 736-3588
Map of St. Andrew School
Gr: PK-8 | 145 students
Catholic
1621 Ferndale Ave
Johnstown, PA 15905
(814) 288-2811
Map of St. Demetrius School
Gr: K-8 | 62 students
Catholic
825 Church Street
Gallitzin, PA 16641
(814) 886-8772
Map of St. Mary Elementary School
Gr: PK-8 | 85 students
Catholic
1005 Caroline Street
Nanty Glo, PA 15943
(814) 749-9031
Map of St. Patrick Elementary School
Gr: PK-8 | 177 students
Catholic
625 Park Avenue
Johnstown, PA 15902
(814) 535-2926
Map of St. Sophia Orthodox Christian Academy
Gr: PK-6 | 18 students
Greek Orthodox
111 Alberta Ave
Johnstown, PA 15905
(814) 255-4377
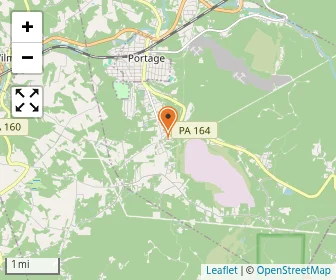
Map of Wesleyan Holiness Academy
Gr: K-12 | 18 students
Methodist
115 Poorman Drive
Portage, PA 15946
(814) 736-3773

Overview

Category
This State (PA)
US
# Schools
14 Schools

Showing 2016–2025. Full 11-year historical data available below ↓

Private schools down 2 in Cambria County, falling from 16 in 2016 to 14 in 2025.
# Students
2,130 Students
273,337 Students

Showing 2016–2025. Full 11-year historical data available below ↓

Private school size down 22 in Cambria County, average enrollment fell from 174 students in 2016 to 152 in 2025.
% Average Students of Color
9%
27%

Showing 2016–2025. Full 11-year historical data available below ↓

Students of color up 4 points in Cambria County private schools, rising from 5% in 2016 to 9% in 2025.

Academics and Faculty:

# Teachers
176 Teachers
24,118 Teachers
Average Student-Teacher Ratio
12:1
11:1

Showing 2016–2025. Full 11-year historical data available below ↓

Student-teacher ratio down 2 in Cambria County private schools, from 14:1 in 2016 to 12:1 in 2025.
% Average Faculty w/Advanced Degree
40%
54%
Average Class Size
17 students
15 students
Average Number of AP Courses
8 courses
12 courses

Tuition and Acceptance Rate:

Average Yearly Tuition Cost
$5,122
$13,234
Average % on Financial Aid
45%
47%
Average Financial Aid Grant
$2,800
$6,819
Average Acceptance Rate
90%
86%

Students by Ethnicity:

0.46
0.60

Showing 2016–2025. Full 11-year historical data available below ↓

Diversity score up 14 points in Cambria County private schools, rising from 0.32 in 2016 to 0.46 in 2025.
# American Indian Students
0 Students
349 Students
% American Indian Students
0%
<1%
# Asian Students
26 Students
9,350 Students
% Asian Students
1%
3%

Showing 2016–2025. Full 11-year historical data available below ↓

Asian share fell 3 points in Cambria County private schools, from 4% in 2023 to 1% in 2025.
# Hispanic Students
16 Students
12,723 Students
% Hispanic Students
1%
5%
# Black Students
67 Students
27,067 Students
% Black Students
3%
10%

Showing 2016–2025. Full 11-year historical data available below ↓

Black share up 2 points in Cambria County private schools, from 1% in 2016 to 3% in 2025.
# White Students
1,478 Students
159,407 Students
% White Students
69%
58%

Showing 2016–2025. Full 11-year historical data available below ↓

White share down 12 points in Cambria County private schools, from 81% in 2016 to 69% in 2025.
# Hawaiian Students
6 Students
253 Students
% Hawaiian Students
<1%
<1%
# Others Students
561 Students
65,301 Students
% of Others Students
26%
24%

Showing 2016–2025. Full 11-year historical data available below ↓

Other-race share rose 10 points in Cambria County private schools, from 16% in 2016 to 26% in 2025.
All Ethnic Groups

Extracurriculars and Sports:

Average Number of Extracurriculars
1 extracurriculars
10 extracurriculars
Average Number of Sports
9 sports
7 sports

Frequently Asked Questions

What are the top ranked private schools in Cambria County, PA?
The top ranked private schools in Cambria County, PA include St. Michael School, Divine Mercy Catholic Academy,west Campus, and Holy Name Elementary School.
How many private schools are located in Cambria County?
14 private schools are located in Cambria County.
How diverse are private schools in Cambria County?
Cambria County private schools are approximately 9% minority students, which is lower than the Pennsylvania private school average of 27%.
What percentage of students in Cambria County go to private school?
12% of all K-12 students in Cambria County are educated in private schools (compared to the PA state average of 14%).
What percentage of private schools are religiously affiliated in Cambria County?
79% of private schools in Cambria County are religiously affiliated (most commonly Catholic and Brethren).
Which private schools in Cambria County are often viewed compared to one another?

Recent Articles

When a Private School Changes Head of School
A private school leadership change can raise important questions. Learn how to evaluate head of school transitions, identify warning signs, and protect your child's educational experience before enrolling confidently.
Private School Financial Aid Renewal: Could Awards Shrink?
Could your private school financial aid shrink next year? Learn why awards change, how income and school budgets affect renewal, and what parents can do to protect affordability long-term.
Need-Blind vs. Need-Aware Private School Admissions
Understand how need-blind and need-aware private school admissions affect acceptance decisions, financial aid eligibility, and affordability, with practical guidance to help parents compare schools, ask questions, and plan confidently ahead.

Filter Schools

School Level
Must Offer Grade
Show more
Gender
School Focus
Religious Affiliation
ADD/ADHD Support
Summer Program

Quick Links