Lynchburg City Private Schools

For the 2026-27 school year, there are 11 private schools serving 8,216 students in Lynchburg City, VA (there are 29 public schools, serving 11,062 public students). 43% of all K-12 students are educated in private schools (compared to the VA state average of 11%).
The average acceptance rate is 82%, which is same as the Virginia private school average acceptance rate of 82%.
58% of private schools in Lynchburg City, VA are religiously affiliated (most commonly Episcopal and Seventh Day Adventist).

Quick Facts (26-27)

  • # Private Schools: 11
  • # Students Served: 8,216
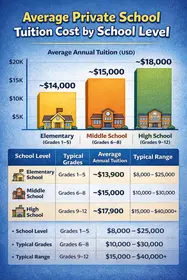
  • Average Tuition: $21,930
  • Student-Teacher Ratio: 21:1
  • Acceptance Rate: 82%
  • % Students on Financial Aid: 29%
  • Average Class Size: 12 students
  • % Students of Color: 25%
  • View Lynchburg City, VA School Trends
  • Averages cover the schools that report each figure.
Quick Facts (26-27)

  • # Private Schools: 11
  • # Students Served: 8,216
  • Average Tuition: $21,930
  • Student-Teacher Ratio: 21:1
  • Acceptance Rate: 82%
  • % Students on Financial Aid: 29%
  • Average Class Size: 12 students
  • % Students of Color: 25%
  • View Lynchburg City, VA School Trends
  • Averages cover the schools that report each figure.
Top Ranked Lynchburg City Private Schools (2026-27)

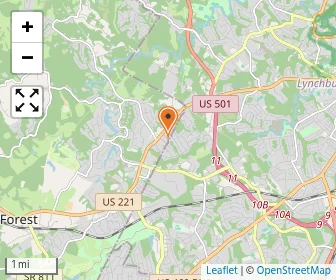
Map of James River Day School
Gr: K-8 | 260 students
Avg. class size: 14 students
Sports: 5 | Extracurriculars: 2
5039 Boonsboro Rd
Lynchburg, VA 24503
(434) 384-7385
(3)
Liberty Christian Academy Photo
Gr: PK-12 | 1,956 students
Avg. class size: 18 students
Sports: 17 | Extracurriculars: 6
Baptist
3701 Candlers Mountain Rd
Lynchburg, VA 24502
(434) 832-2000
(3)
New Covenant Schools Photo
Gr: PK-12 | 482 students
Sports: 8 | Extracurriculars: 2
Episcopal
122 Fleetwood Dr
Lynchburg, VA 24501
(434) 847-8313
Virginia Episcopal School Photo
Gr: 9-12 | 234 students
Avg. class size: 12 students
Sports: 17 | Extracurriculars: 33
Episcopal
400 VES Road
Lynchburg, VA 24503
(434) 385-3600
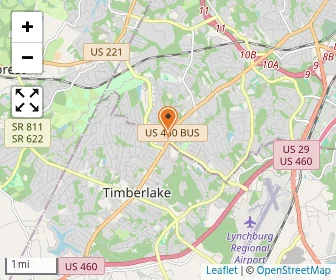
Map of Blue Ridge Montessori School
Gr: PK-K | 136 students
Sports: 3 | Extracurriculars: 7
Montessori School
1071 Woodberry Square Pl
Lynchburg, VA 24502
(434) 525-0061
(3)
Map of The Branches Academy & Early Learning Center
Gr: PK-2 | 129 students
Pentecostal
2812 Greenview Dr
Lynchburg, VA 24502
(434) 455-0294
(1)
Map of Bridges Treatment Center
Gr: 3-11 | 22 students
Alternative School
693 Leesville Rd
Lynchburg, VA 24502
(434) 200-5062
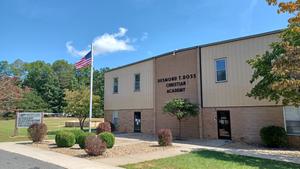
Desmond T. Doss Christian Academy Photo
Gr: PK-10 | 77 students
Sports: 2
Seventh Day Adventist
19 George St
Lynchburg, VA 24502
(434) 237-1899
Map of Montessori Childrens House
Gr: PK-K | 60 students
Montessori School
1400 Lakeside Drive, Unit B
Lynchburg, VA 24501
(434) 528-3216
New Vistas School Photo
Gr: 4-12 | 37 students
Avg. class size: 4 students
Special Education School
520 Eldon St
Lynchburg, VA 24501
(434) 846-0301
(11)
Map of Rivermont Lynchburg North
Gr: 1-12 | 34 students
Special Education School
3024 Forest Hills Cir
Lynchburg, VA 24501
(434) 200-9257

Overview

Category
This State (VA)
US
# Schools
12 Schools
The number of private schools in Lynchburg City County rose from 10 in 2017 to 12 in 2025.
# Students
8,216 Students
151,232 Students
Average private school enrollment per school in Lynchburg City County rose from 320 students in 2019 to 679 in 2025, far above Virginia's 169 and the U.S. 178.
% Average Students of Color
25%
31%

Academics and Faculty:

# Teachers
388 Teachers
14,321 Teachers
Average Student-Teacher Ratio
21:1
10:1
% Average Faculty w/Advanced Degree
61%
55%
Average Class Size
12 students
14 students
Average Number of AP Courses
11 courses
12 courses
Average SAT score
1187
(Out of 1600)
1231
Average ACT score
24
(Out of 36)
27

Tuition and Acceptance Rate:

Average Yearly Tuition Cost
$21,930
$16,104
Average % on Financial Aid
29%
30%
Average Financial Aid Grant
$12,567
$9,180
Average Acceptance Rate
82%
82%
Average Endowment Size
$44 million
$51 million

Students by Ethnicity:

0.49
0.65
The average diversity score for private schools in Lynchburg City County was 0.48 in 2025, 0.17 lower than the Virginia and United States average of 0.65.
# American Indian Students
3 Students
492 Students
% American Indian Students
<1%
<1%
# Asian Students
609 Students
8,941 Students
% Asian Students
7%
6%
# Hispanic Students
613 Students
6,674 Students
% Hispanic Students
8%
5%
# Black Students
600 Students
11,974 Students
% Black Students
7%
8%
# White Students
5,798 Students
72,309 Students
% White Students
70%
49%
The share of private school students who are White in Lynchburg City held at 71% in 2024 and 2025, 22 points higher than Virginia's 49% in 2025.
# Hawaiian Students
3 Students
370 Students
% Hawaiian Students
<1%
<1%
# Others Students
631 Students
47,635 Students
% of Others Students
8%
32%
All Ethnic Groups

Extracurriculars and Sports:

Average Number of Extracurriculars
10 extracurriculars
10 extracurriculars
Average Number of Sports
9 sports
7 sports

Frequently Asked Questions

What are the top ranked private schools in Lynchburg City, VA?
The top ranked private schools in Lynchburg City, VA include Virginia Episcopal School, Liberty Christian Academy, and New Covenant Schools.
How many private schools are located in Lynchburg City?
11 private schools are located in Lynchburg City.
How diverse are private schools in Lynchburg City?
Lynchburg City private schools are approximately 25% minority students, which is lower than the Virginia private school average of 31%.
What percentage of students in Lynchburg City go to private school?
43% of all K-12 students in Lynchburg City are educated in private schools (compared to the VA state average of 11%).
What percentage of private schools are religiously affiliated in Lynchburg City?
58% of private schools in Lynchburg City are religiously affiliated (most commonly Episcopal and Seventh Day Adventist).
Which private schools in Lynchburg City are often viewed compared to one another?

Recent Articles

When Private Schools Cannot Offer Advanced Subjects
Discover what parents can do when private schools cannot offer advanced subjects, including alternative courses, independent study, college partnerships, graduation requirements, and strategies for maintaining academic progress and future opportunities.
Child Refuses Private School Activities
Learn why children refuse private school group activities, how schools respond, when participation becomes mandatory, and practical ways parents can address anxiety, resistance, social difficulties, and student confidence effectively.
When Private School Classmates Have More Money
Discover how to help your child navigate wealth differences at private school, manage social pressure, build confidence, maintain friendships, and feel included without stretching your family's budget or compromising values.

Filter Schools

School Level
Must Offer Grade
Show more
Gender
School Focus
Religious Affiliation
ADD/ADHD Support
Summer Program

Quick Links