New London County Private High Schools

For the 2026-27 school year, there are 14 private high schools serving 1,332 students in New London County, CT.
The average acceptance rate is 85%, which is higher than the Connecticut private high school average acceptance rate of 66%.
29% of private high schools in New London County, CT are religiously affiliated (most commonly Catholic and Baptist).

Quick Facts (26-27)

  • # Private Schools: 14
  • # Students Served: 1,332
  • Average Tuition: $26,472
  • % Students on Financial Aid: 49%
  • Acceptance Rate: 85%
  • Average Class Size: 11 students
  • % Students of Color: 28%
  • View New London County, CT School Trends
Quick Facts (26-27)

  • # Private Schools: 14
  • # Students Served: 1,332
  • Average Tuition: $26,472
  • % Students on Financial Aid: 49%
  • Acceptance Rate: 85%
  • Average Class Size: 11 students
  • % Students of Color: 28%
  • View New London County, CT School Trends
Top Ranked New London County Private High Schools (2026-27)

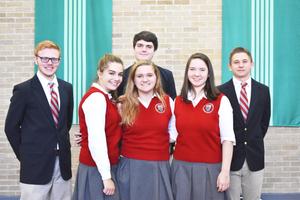
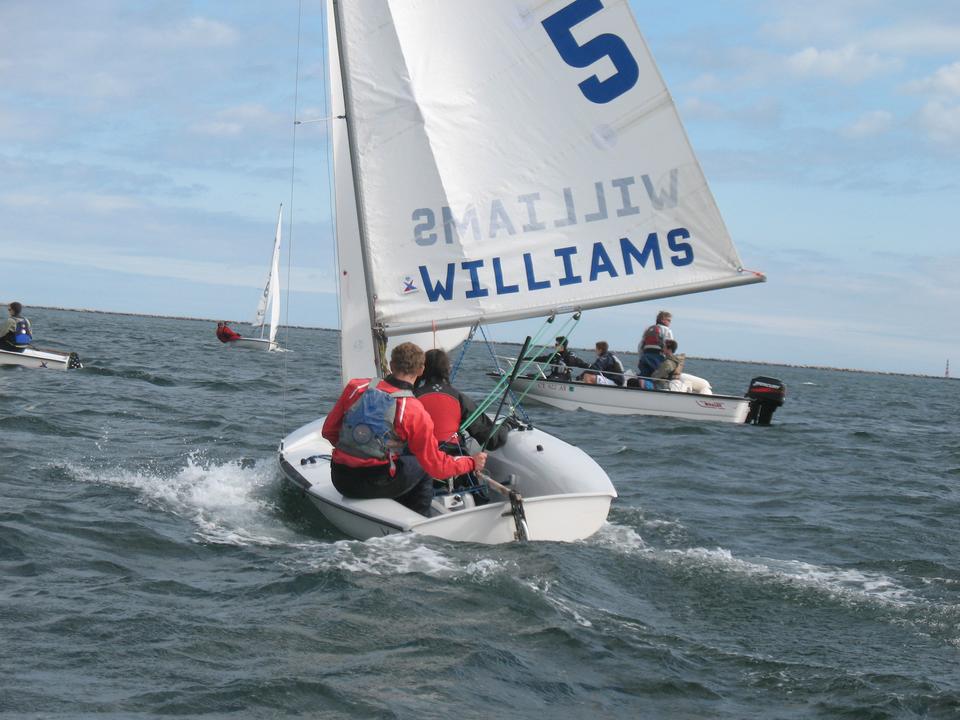
The Williams School Photo
Gr: 6-12 | 191 students
Avg. class size: 11 students
Sports: 7 | Extracurriculars: 11
182 Mohegan Avenue
New London, CT 06320
(860) 443-5333
(5)
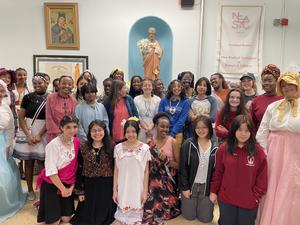
St. Thomas More School Photo
Gr: 8-12 | 192 students
Avg. class size: 11 students
Sports: 8 | Extracurriculars: 10
45 Cottage Road
Oakdale, CT 06370
(860) 823-3861
(2)
Academy Of The Holy Family Photo
Gr: 9-12 | 30 students
Avg. class size: 8 students
Sports: 3 | Extracurriculars: 11
All-girls (Catholic)
54 W Main St. Box 691
Baltic, CT 06330
(860) 822-9272
St. Bernard School Photo
Gr: 6-12 | 410 students
Avg. class size: 19 students
Sports: 14 | Extracurriculars: 37
Catholic
1593 Norwich New London Tpke
Uncasville, CT 06382
(860) 848-1271
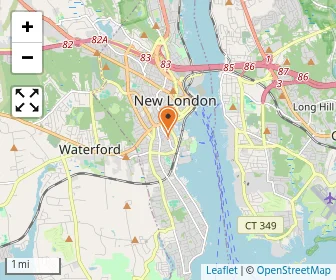
Map of Baptist Bible Academy
Gr: K-12 | 59 students
Baptist
1144 Hartford Tpke
Waterford, CT 06385
(860) 442-0277
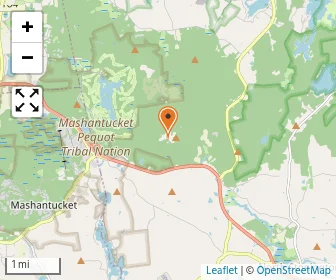
Map of Bradley School-new London Regional
Gr: K-12 | 44 students
Specialized Curriculum
26 Maple Ave
Uncasville, CT 06382
(401) 606-4100
Map of Joshua Center Thames Valley
Gr: 7-12 | 21 students
Special Education School
11a Stott Ave
Norwich, CT 06360
(860) 823-5320
Map of The Light House (Lighthouse Voc-ed Center Inc.)
Gr: 2-12 | 22 students
Special Education School
125 Shaw St.
New London, CT 06320
(860) 445-7626
Map of The Light House Voc-ed Center
Gr: 1-10 | 6 students
Special Education School
312 Main St
Niantic, CT 06357
(860) 445-7626
Map of Lighthouse Voc-ed Center (site 3)
Gr: 5-12 | 34 students
Special Education School
58 Pennsylvania Ave
Niantic, CT 06357
(860) 445-7626
Map of North Stonington Christian Academy
Gr: PK-12 | 62 students
Avg. class size: 12 students
Sports: 2
Baptist
12 Stillman Rd
North Stonington, CT 06359
(860) 599-5071
(1)
Map of Pine Point School
Gr: PK-9 | 166 students
Avg. class size: 11 students
Sports: 8 | Extracurriculars: 7
89 Barnes Rd
Stonington, CT 06378
(860) 535-0606
Map of Stonington Institute School
Gr: 7-12 | 43 students
Alternative School
75 Swantown Hill Road
North Stonington, CT 06359
(860) 449-0611
Map of Waterford Country School
Gr: 2-12 | 52 students
Avg. class size: 6 students
Special Education School
78 Hunts Brook Rd
Quaker Hill, CT 06375
(860) 442-9454
[+] Show Closed Private Schools in New London County, Connecticut

New London County Private High Schools (Closed)

Map of High Road School Of New London Md/high At Shiloh
Gr: 7-12 | 11 students
Special Education School
3 Garvin St
New London, CT 06320
(860) 443-1007
Map of St. Joseph School
Gr: NS-9 | 118 students
Catholic
120 Cliff St
Norwich, CT 06360
(860) 887-1565
Map of St. Mary Elementary School
Gr: PK-8 | 95 students
Catholic
54 N Main Street
Jewett City, CT 06351
(860) 376-0446
(1)
Map of St. Mary's Star Of The Sea
Gr: PK-8 | 120 students
Avg. class size: 15 students
Catholic
16 Huntington Street
New London, CT 06320
(860) 443-7758
(1)

Overview

Category
This State (CT)
US
# Schools
14 Schools

Showing 2016–2025. Full 11-year historical data available below ↓

# Students
1,332 Students
36,675 Students

Showing 2016–2025. Full 11-year historical data available below ↓

% Average Students of Color
28%
32%

Showing 2016–2025. Full 11-year historical data available below ↓

Academics and Faculty:

# Teachers
179 Teachers
5,396 Teachers
Average Student-Teacher Ratio
7:1
7:1

Showing 2016–2025. Full 11-year historical data available below ↓

% Average Faculty w/Advanced Degree
77%
74%

Showing 2016–2025. Full 11-year historical data available below ↓

Average Class Size
11 students
12 students

Showing 2016–2025. Full 11-year historical data available below ↓

Average Number of AP Courses
9 courses
19 courses
Average SAT score
1179
(Out of 1600)
1255
Average ACT score
27
(Out of 36)
28

Tuition and Acceptance Rate:

Average Yearly Tuition Cost
$26,472
$41,572
Average Summer Program Cost
$4,950
$0
Average % on Financial Aid
49%
38%

Showing 2016–2025. Full 11-year historical data available below ↓

Average Financial Aid Grant
$16,145
$25,479
Average Acceptance Rate
85%
66%
Average Endowment Size
$10.25 million
$76.31 million

Students by Ethnicity:

0.54
0.57

Showing 2016–2025. Full 11-year historical data available below ↓

# American Indian Students
9 Students
645 Students
% American Indian Students
1%
2%
# Asian Students
82 Students
2,248 Students
% Asian Students
7%
6%

Showing 2016–2025. Full 11-year historical data available below ↓

# Hispanic Students
76 Students
2,914 Students
% Hispanic Students
7%
8%

Showing 2016–2025. Full 11-year historical data available below ↓

# Black Students
94 Students
2,975 Students
% Black Students
8%
9%

Showing 2016–2025. Full 11-year historical data available below ↓

# White Students
770 Students
22,151 Students
% White Students
66%
64%

Showing 2016–2025. Full 11-year historical data available below ↓

# Hawaiian Students
1 Student
29 Students
% Hawaiian Students
<1%
<1%
# Others Students
129 Students
3,801 Students
% of Others Students
11%
11%

Showing 2016–2025. Full 11-year historical data available below ↓

All Ethnic Groups

Extracurriculars and Sports:

Average Number of Extracurriculars
15 extracurriculars
19 extracurriculars
Average Number of Sports
7 sports
13 sports

Frequently Asked Questions

What are the top ranked private high schools in New London County, CT?
The top ranked private high schools in New London County, CT include St. Bernard School, Academy Of The Holy Family, and The Williams School.
How many private high schools are located in New London County?
14 private high schools are located in New London County.
How diverse are private high schools in New London County?
New London County private high schools are approximately 28% minority students, which is lower than the Connecticut private school average of 32%.
What percentage of private high schools are religiously affiliated in New London County?
29% of private high schools in New London County are religiously affiliated (most commonly Catholic and Baptist).
Which private high schools in New London County are often viewed compared to one another?

Recent Articles

Can Private Schools Raise Fees After You Sign?
Can private schools increase mandatory fees after enrollment contracts are signed? Learn how contract terms, fee disclosures, state laws, and parent rights affect unexpected charges and available options.
Financial Aid When a Sibling Graduates Private School
Learn how private school financial aid may change when an older sibling graduates, including revised family contributions, sibling discounts, college expenses, renewal decisions, and practical steps to protect affordability.
Private School Expansion: Preserving School Culture
Discover how growing private schools can expand enrollment while preserving small classes, personal attention, strong relationships, and school culture, plus essential questions parents should ask before choosing a school.

Filter Schools

School Level
Must Offer Grade
Show more
Gender
School Focus
Religious Affiliation
ADD/ADHD Support
Summer Program

Quick Links