Grafton County Private Schools

For the 2026-27 school year, there are 15 private schools serving 1,258 students in Grafton County, NH (there are 52 public schools, serving 10,978 public students). 10% of all K-12 students are educated in private schools (compared to the NH state average of 16%).
The average acceptance rate is 76%, which is lower than the New Hampshire private school average acceptance rate of 77%.
19% of private schools in Grafton County, NH are religiously affiliated (most commonly Christian and Baptist).

Quick Facts (26-27)

  • # Private Schools: 15
  • # Students Served: 1,258
  • Average Tuition: $30,080
  • % Students on Financial Aid: 32%
  • Acceptance Rate: 76%
  • Average Class Size: 12 students
  • % Students of Color: 23%
  • View Grafton County, NH School Trends
Quick Facts (26-27)

  • # Private Schools: 15
  • # Students Served: 1,258
  • Average Tuition: $30,080
  • % Students on Financial Aid: 32%
  • Acceptance Rate: 76%
  • Average Class Size: 12 students
  • % Students of Color: 23%
  • View Grafton County, NH School Trends
Top Ranked Grafton County Private Schools (2026-27)

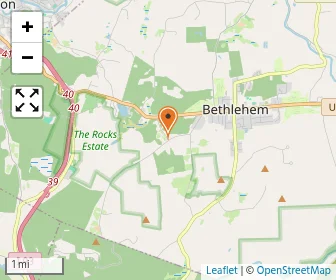
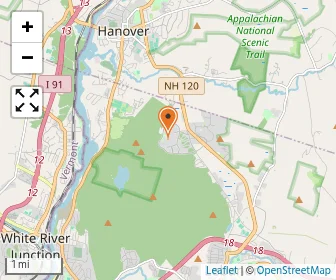
Map of Bethlehem Christian School
Gr: K-12 | 22 students
Avg. class size: 25 students
Alternative School (Christian)
1858 Maple St
Bethlehem, NH 03574
(603) 869-5401
(1)
Cardigan Mountain School Photo
Gr: 6-9 | 240 students
Avg. class size: 12 students
Sports: 16 | Extracurriculars: 18
All-boys
62 Alumni Drive
Canaan, NH 03741
(603) 523-3548
Holderness School Photo
Gr: 9-12 | 380 students
Avg. class size: 12 students
Sports: 21 | Extracurriculars: 20
Episcopal
33 Chapel Lane
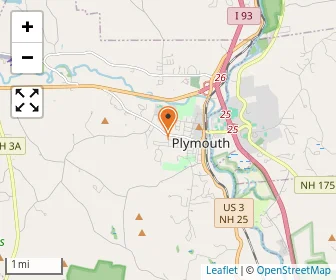
Plymouth, NH 03264
(603) 536-1257
(2)
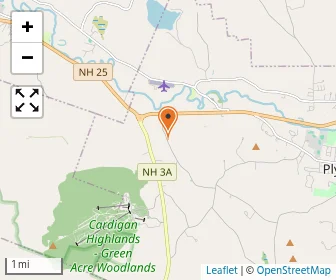
Map of Plymouth State University Cd & Fc
Gr: PK-K | 47 students
Daycare / Preschool
Msc 46
Plymouth, NH 03264
(603) 535-2299
Map of Calvary Christian School
Gr: 7-11 | 6 students
Avg. class size: 4 students
Sports: 2
Baptist
115 Yeaton Rd
Plymouth, NH 03264
(603) 536-4022
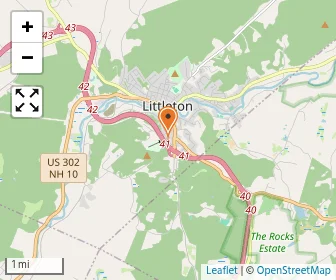
Map of The Children S House
Gr: PK-K | 40 students
Montessori School
75 Bronson St
Littleton, NH 03561
(603) 444-6464
Crossroads Academy Photo
Gr: K-8 | 128 students
Avg. class size: 14 students
Extracurriculars: 7
95 Dartmouth College Highway
Lyme, NH 03768
(603) 795-3111
(7)
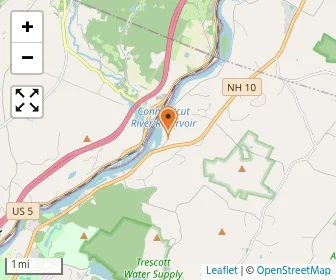
Map of Dhmc Child Care Center
Gr: NS | 61 students
Daycare / Preschool
1 Medical Center Drive
Lebanon, NH 03756
(603) 643-6504
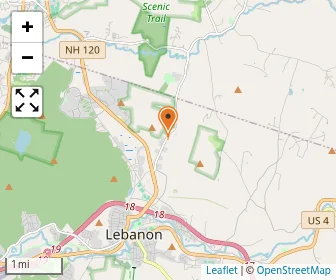
Map of The Montessori Children's School
Gr: PK-K | 42 students
Montessori School
67 Trescott Road
Etna, NH 03750
(603) 643-2828
Map of Montessori Discovry School Of The Twin States, Inc
Gr: PK-K | 40 students
Montessori School
112 Etna Road
Lebanon, NH 03766
(603) 667-8166
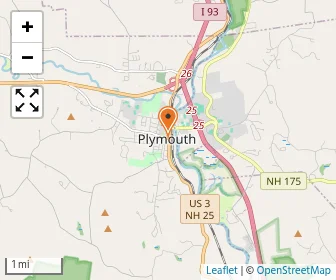
Map of Mount Prospect Academy
Gr: 7-12 | 110 students
All-boys | Special Education School
354 Main St
Plymouth, NH 03264
(603) 536-1102
Oliverian School Photo
Gr: 9-12 | 26 students
Sports: 2 | Extracurriculars: 9
28 Becket Dr
Pike, NH 03780
(603) 989-5100
(4)
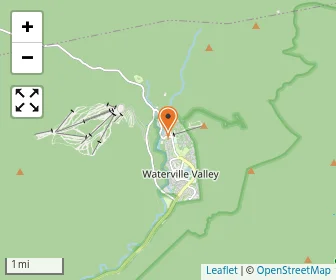
Map of Waterville Valley Academy
Gr: 9-12 | 42 students
Avg. class size: 2 students
Sports: 3
Specialized Curriculum
88 Boulder Path Rd.
Waterville Valley, NH 03215
(603) 236-4246
Map of White Mountain Montessori School
Gr: NS | 28 students
Montessori School
133 Mount Prospect Road,
Holderness, NH 03245
(603) 536-2555
Woodland Community School Photo
Gr: K-6 | 18 students
Alternative School
809 Brook Rd
Bethlehem, NH 03574
(603) 444-1221
[+] Show Closed Private Schools in Grafton County, New Hampshire

Grafton County Private Schools (Closed)

Map of The Hunter School
Gr: NS | 33 students
Special Education School
768 Doetown Rd
Rumney, NH 03266
(603) 786-9427
The White Mountain School Photo
Gr: 9-12 | 137 students
Avg. class size: 10 students
Catholic
371 West Farm Road
Bethlehem, NH 03574
(603) 444-2928
(2)

Overview

Category
This State (NH)
US
# Schools
16 Schools

Showing 2016–2025. Full 11-year historical data available below ↓

Private schools down 2 in Grafton County, falling from 18 in 2016 to 16 in 2025.
# Students
1,258 Students
31,847 Students

Showing 2016–2025. Full 11-year historical data available below ↓

Average students up 6 in Grafton County, the private-school average rose from 73 in 2016 to 79 in 2025.
% Average Students of Color
23%
19%

Showing 2016–2025. Full 11-year historical data available below ↓

Students of color down 7 points in Grafton County private schools, from 30% in 2021 to 23% in 2025.

Academics and Faculty:

# Teachers
209 Teachers
3,214 Teachers
Average Student-Teacher Ratio
6:1
10:1

Showing 2016–2025. Full 11-year historical data available below ↓

Student-teacher ratio now 6:1 in Grafton County private schools, lower than New Hampshire's 10:1 and the U.S. 11:1 in 2025.
% Average Faculty w/Advanced Degree
69%
54%
Advanced degrees up 9 points in Grafton County private schools, rising from 60% in 2016 to 69% in 2025.
Average Class Size
12 students
12 students

Showing 2016–2025. Full 11-year historical data available below ↓

Average Number of AP Courses
17 courses
22 courses
Average SAT score
1253
(Out of 1600)
1242
Average ACT score
25
(Out of 36)
28

Tuition and Acceptance Rate:

Average Yearly Tuition Cost
$30,080
$19,700
Tuition up 28% in Grafton County, rising from $25,493 in 2016 to $32,725 in 2025.
Average Summer Program Cost
$4,400
$2,531
Average % on Financial Aid
32%
36%
Average Financial Aid Grant
$23,000
$19,290
Average Acceptance Rate
76%
77%
Average Endowment Size
$44.75 million
$59.12 million

Students by Ethnicity:

0.60
0.57

Showing 2016–2025. Full 11-year historical data available below ↓

Diversity score flat at 0.60 in Grafton County private schools in 2025, little changed from 0.59 in 2016.
# American Indian Students
1 Student
103 Students
% American Indian Students
<1%
<1%
American Indian share up 1 point in Grafton County private schools, rising from 2% in 2015 to 3% in 2019.
# Asian Students
90 Students
1,247 Students
% Asian Students
8%
4%

Showing 2016–2025. Full 11-year historical data available below ↓

Asian share up 3 points in Grafton County private schools, from 5% in 2016 to 8% in 2025.
# Hispanic Students
39 Students
833 Students
% Hispanic Students
3%
3%

Showing 2016–2025. Full 11-year historical data available below ↓

Hispanic share fell 2 points in Grafton County private schools, from 5% in 2016 to 3% in 2025, while the U.S. was 9% in 2025.
# Black Students
30 Students
705 Students
% Black Students
3%
2%

Showing 2016–2025. Full 11-year historical data available below ↓

Black student share rose 1 point in Grafton County private schools, from 2% in 2016 to 3% in 2025 while New Hampshire stayed at 2%.
# White Students
619 Students
16,749 Students
% White Students
55%
55%

Showing 2016–2025. Full 11-year historical data available below ↓

White share down 3 points from 58% in 2016 to 55% in 2025 in Grafton County private schools.
# Hawaiian Students
0 Students
8 Students
% Hawaiian Students
0%
<1%
# Others Students
351 Students
10,776 Students
% of Others Students
31%
36%

Showing 2016–2025. Full 11-year historical data available below ↓

Other-race share up 3 points in Grafton County private schools, from 28% in 2016 to 31% in 2025.
All Ethnic Groups

Extracurriculars and Sports:

Average Number of Extracurriculars
14 extracurriculars
10 extracurriculars
Average Number of Sports
9 sports
9 sports

Frequently Asked Questions

What are the top ranked private schools in Grafton County, NH?
The top ranked private schools in Grafton County, NH include Holderness School, Bethlehem Christian School, and Plymouth State University Cd & Fc.
How many private schools are located in Grafton County?
15 private schools are located in Grafton County.
How diverse are private schools in Grafton County?
Grafton County private schools are approximately 23% minority students, which is higher than the New Hampshire private school average of 19%.
What percentage of students in Grafton County go to private school?
10% of all K-12 students in Grafton County are educated in private schools (compared to the NH state average of 16%).
What percentage of private schools are religiously affiliated in Grafton County?
19% of private schools in Grafton County are religiously affiliated (most commonly Christian and Baptist).
Which private schools in Grafton County are often viewed compared to one another?

Recent Articles

When a Private School Changes Head of School
A private school leadership change can raise important questions. Learn how to evaluate head of school transitions, identify warning signs, and protect your child's educational experience before enrolling confidently.
Private School Financial Aid Renewal: Could Awards Shrink?
Could your private school financial aid shrink next year? Learn why awards change, how income and school budgets affect renewal, and what parents can do to protect affordability long-term.
Need-Blind vs. Need-Aware Private School Admissions
Understand how need-blind and need-aware private school admissions affect acceptance decisions, financial aid eligibility, and affordability, with practical guidance to help parents compare schools, ask questions, and plan confidently ahead.

Filter Schools

School Level
Must Offer Grade
Show more
Gender
School Focus
Religious Affiliation
ADD/ADHD Support
Summer Program

Quick Links