El Dorado County Private Schools

For the 2026-27 school year, there are 15 private schools serving 1,527 students in El Dorado County, CA (there are 69 public schools, serving 35,640 public students). 4% of all K-12 students are educated in private schools (compared to the CA state average of 10%).
The average acceptance rate is 91%, which is higher than the California private school average acceptance rate of 83%.
22% of private schools in El Dorado County, CA are religiously affiliated (most commonly Christian and Seventh Day Adventist).

Quick Facts (26-27)

Quick Facts (26-27)

Top Ranked El Dorado County Private Schools (2026-27)

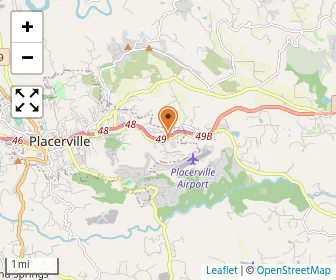
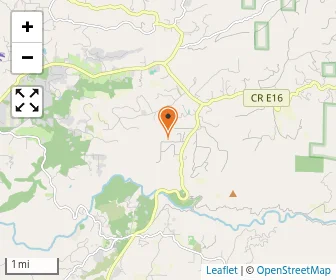
Map of El Dorado Adventist School
Gr: K-8
Avg. class size: 13 students
Sports: 5
Seventh Day Adventist
1900 Broadway
Placerville, CA 95667
(530) 622-3560
(1)
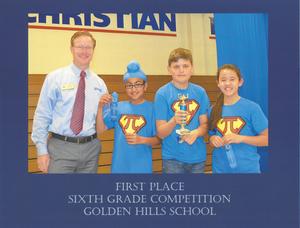
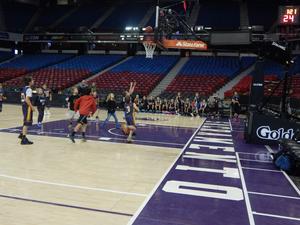
Ghs Academy- Golden Hills School Photo
Gr: PK-8 | 168 students
Avg. class size: 15 students
Sports: 6 | Extracurriculars: 5
1060 Suncast Lane
El Dorado Hills, CA 95762
(916) 933-0100
(9)
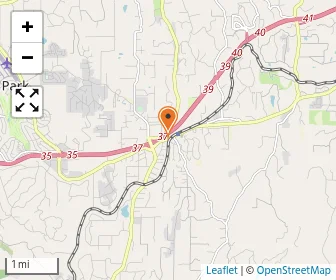
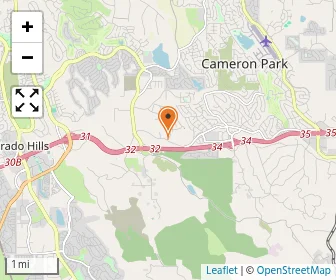
Map of Cameron Park Montessori
Gr: PK-K | 59 students
Avg. class size: 28 students
Montessori School
4140 Mother Lode Dr Ste 100
Shingle Springs, CA 95682
(530) 677-1776
(2)
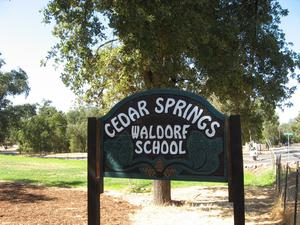
Cedar Springs Waldorf School Photo
Gr: PK-8 | 161 students
Avg. class size: 15 students
Sports: 2
Specialized Curriculum
6029 Gold Meadows Road
Placerville, CA 95667
(530) 642-9903
(6)
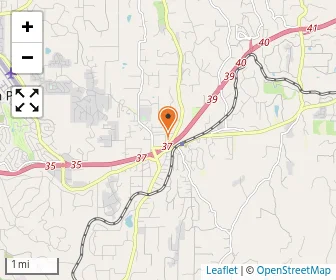
Map of Country Day Montessori
Gr: PK-K | 28 students
Montessori School
2771 Spear St.
Placerville, CA 95667
(530) 626-1202
(1)
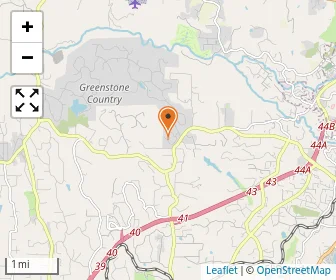
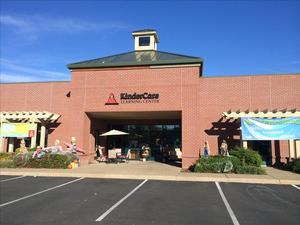
El Dorado Hills KinderCare Photo
Gr: NS-PK | 30 students
Daycare / Preschool
3959 Park Dr.
El Dorado Hills, CA 95762
(916) 939-0391
Map of First Friends Montessori
Gr: K-4 | 24 students
Avg. class size: 8 students
Montessori School
3132 Sheridan St
Placerville, CA 95667
(530) 642-0567
(2)
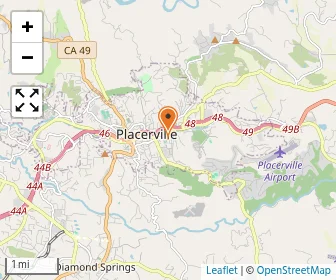
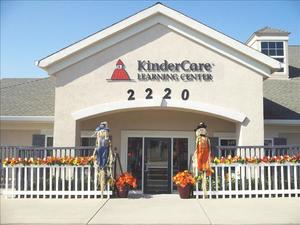
Francisco Drive KinderCare Photo
Gr: NS-PK
Daycare / Preschool
2220 Francisco Dr.
El Dorado Hills, CA 95762
(916) 941-0358
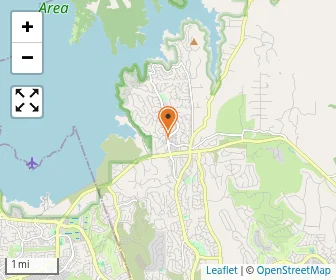
Map of Gift Of Kids Inc
Gr: PK-K | 185 students
Daycare / Preschool
5130 Golden Foothill Pkwy
El Dorado Hills, CA 95762
(916) 941-8451
Map of Holy Trinity School
Gr: K-8 | 228 students
Catholic
3115 Tierra De Dios Drive
El Dorado Hills, CA 95762
(530) 677-3591
Marble Valley Academy Photo
Gr: NS-10 | 167 students
Avg. class size: 15 students
Sports: 7 | Extracurriculars: 3
5005 Hillsdale Cirlce
El Dorado Hills, CA 95762
(916) 933-5122
(5)
Map of Montessori Manor
Gr: PK-K | 67 students
Avg. class size: 20 students
Montessori School
2222 Francisco Dr # 400
El Dorado Hills, CA 95762
(916) 835-3905
(9)
Map of Providence Christian School
Gr: PK-8 | 230 students
Avg. class size: 22 students
Extracurriculars: 3
Christian
3800 North Shingle Road
Shingle Springs, CA 95682
(530) 672-6657
Map of Summitview Academy
Gr: 7-12 | 35 students
Special Education School
670 Placerville Dr Ste 1b
Placerville, CA 95667
(530) 644-2412
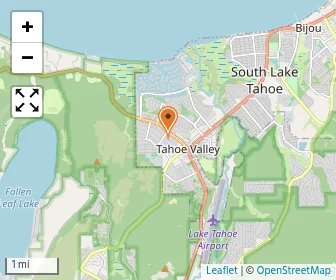
Map of Tahoe Prep Academy
Gr: 9-12 | 36 students
All-boys
2478 Meyers Grade Rd
South Lake Tahoe, CA 96150
(844) 752-9842
[+] Show Closed Private Schools in El Dorado County, California

El Dorado County Private Schools (Closed)

Map of Madrone Montessori School
Gr: K-2 | 28 students
Montessori School
3498 Green Valley Rd
Rescue, CA 95672
(530) 676-4110
Map of Sierra Ranch School
Gr: 2-12 | 28 students
All-boys | Special Education School
4300 Forni Rd
Diamond Springs, CA 95619
(530) 626-3106
Map of Summitview
Gr: 6-12 | 22 students
All-girls | Special Education School
5036 Sunrey Rd
Placerville, CA 95667
(530) 644-2412
Map of Tahoe Montessori House
Gr: NS-K | 36 students
Montessori School
848 Glorene Avenue
South Lake Tahoe, CA 96150
(530) 544-1818

Overview

Category
This State (CA)
US
# Schools
18 Schools

Showing 2016–2025. Full 11-year historical data available below ↓

Private schools down 2 in El Dorado County, falling from 20 in 2024 to 18 in 2025 after peaking at 20.
# Students
1,527 Students
659,615 Students

Showing 2016–2025. Full 11-year historical data available below ↓

Private school size down 14 in El Dorado County, from 109 students in 2016 to 95 in 2025.
% Average Students of Color
29%
52%

Showing 2016–2025. Full 11-year historical data available below ↓

Students of color up 13 points in El Dorado County private schools, rising from 16% in 2016 to 29% in 2025.

Academics and Faculty:

# Teachers
104 Teachers
55,836 Teachers
Average Student-Teacher Ratio
15:1
12:1

Showing 2016–2025. Full 11-year historical data available below ↓

Student-teacher ratio up 2 in El Dorado County private schools, rising from 13:1 in 2016 to 15:1 in 2025.
% Average Faculty w/Advanced Degree
65%
60%
Average Class Size
17 students
17 students

Showing 2016–2025. Full 11-year historical data available below ↓

Average Number of AP Courses
8 courses
15 courses

Tuition and Acceptance Rate:

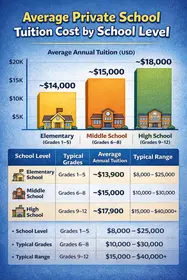
Average Yearly Tuition Cost
$11,056
$17,625
Average Summer Program Cost
$1,200
$1,072
Average % on Financial Aid
30%
29%
Average Acceptance Rate
91%
83%

Students by Ethnicity:

0.63
0.74

Showing 2016–2025. Full 11-year historical data available below ↓

Diversity score up 18 points in El Dorado County private schools, rising from 0.45 in 2016 to 0.63 in 2025.
# American Indian Students
18 Students
3,574 Students
% American Indian Students
1%
1%

Showing 2016–2025. Full 11-year historical data available below ↓

# Asian Students
84 Students
71,777 Students
% Asian Students
5%
11%

Showing 2016–2025. Full 11-year historical data available below ↓

Asian enrollment up 4 points in El Dorado County private schools, rising from 1% in 2016 to 5% in 2025.
# Hispanic Students
100 Students
104,405 Students
% Hispanic Students
7%
16%

Showing 2016–2025. Full 11-year historical data available below ↓

Hispanic enrollment up 1 point in El Dorado County private schools, from 5% in 2016 to 6% in 2025, while California stayed at 16%.
# Black Students
31 Students
30,221 Students
% Black Students
2%
5%

Showing 2016–2025. Full 11-year historical data available below ↓

Black students down 1 point in El Dorado County private schools, from 3% in 2016 to 2% in 2025.
# White Students
780 Students
235,730 Students
% White Students
49%
37%

Showing 2016–2025. Full 11-year historical data available below ↓

White share down 23 points in El Dorado County private schools, from 72% in 2016 to 49% in 2025.
# Hawaiian Students
3 Students
5,499 Students
% Hawaiian Students
<1%
1%
# Others Students
567 Students
188,740 Students
% of Others Students
36%
29%

Showing 2016–2025. Full 11-year historical data available below ↓

Other-race share up 18 points in El Dorado County private schools, from 18% in 2016 to 36% in 2025.
All Ethnic Groups

Extracurriculars and Sports:

Average Number of Extracurriculars
4 extracurriculars
9 extracurriculars
Average Number of Sports
5 sports
7 sports

Frequently Asked Questions

What are the top ranked private schools in El Dorado County, CA?
The top ranked private schools in El Dorado County, CA include Ghs Academy- Golden Hills School and El Dorado Adventist School.
How many private schools are located in El Dorado County?
15 private schools are located in El Dorado County.
How diverse are private schools in El Dorado County?
El Dorado County private schools are approximately 29% minority students, which is lower than the California private school average of 52%.
What percentage of students in El Dorado County go to private school?
4% of all K-12 students in El Dorado County are educated in private schools (compared to the CA state average of 10%).
What percentage of private schools are religiously affiliated in El Dorado County?
22% of private schools in El Dorado County are religiously affiliated (most commonly Christian and Seventh Day Adventist).
Which private schools in El Dorado County are often viewed compared to one another?

Recent Articles

When a Private School Changes Head of School
A private school leadership change can raise important questions. Learn how to evaluate head of school transitions, identify warning signs, and protect your child's educational experience before enrolling confidently.
Private School Financial Aid Renewal: Could Awards Shrink?
Could your private school financial aid shrink next year? Learn why awards change, how income and school budgets affect renewal, and what parents can do to protect affordability long-term.
Need-Blind vs. Need-Aware Private School Admissions
Understand how need-blind and need-aware private school admissions affect acceptance decisions, financial aid eligibility, and affordability, with practical guidance to help parents compare schools, ask questions, and plan confidently ahead.

Filter Schools

School Level
Must Offer Grade
Show more
Gender
School Focus
Religious Affiliation
ADD/ADHD Support
Summer Program

Quick Links