San Luis Obispo County Private Schools

For the 2026-27 school year, there are 23 private schools serving 2,957 students in San Luis Obispo County, CA (there are 83 public schools, serving 31,982 public students). 8% of all K-12 students are educated in private schools (compared to the CA state average of 10%).
The average tuition cost is $11,440, which is lower than the California private school average tuition cost of $17,625.
58% of private schools in San Luis Obispo County, CA are religiously affiliated (most commonly Catholic and Christian).

Quick Facts (26-27)

  • # Private Schools: 23
  • # Students Served: 2,957
  • Average Tuition: $11,440
  • % Students on Financial Aid: 31%
  • Acceptance Rate: 91%
  • Average Class Size: 17 students
  • % Students of Color: 20%
  • View San Luis Obispo County, CA School Trends

Quick Facts (26-27)

  • # Private Schools: 23
  • # Students Served: 2,957
  • Average Tuition: $11,440
  • % Students on Financial Aid: 31%
  • Acceptance Rate: 91%
  • Average Class Size: 17 students
  • % Students of Color: 20%
  • View San Luis Obispo County, CA School Trends
Top Ranked San Luis Obispo County Private Schools (2026-27)

Map of Christ Classical School
Gr: K-6 | 41 students
Avg. class size: 4 students
880 Laureate Lane
San Luis Obispo, CA 93405
(805) 453-6161
Coastal Christian School Photo
Gr: K-12 | 351 students
Avg. class size: 16 students
Sports: 7
Christian
1005 N. Oak Park Blvd.
Pismo Beach, CA 93449
(805) 489-1213
(1)
Mission College Prep High School Photo
Gr: 9-12 | 273 students
Avg. class size: 22 students
Catholic
682 Palm Street
San Luis Obispo, CA 93401
(805) 543-2131
(1)
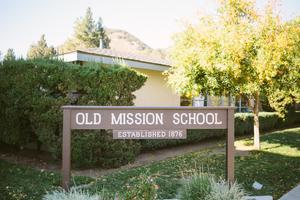
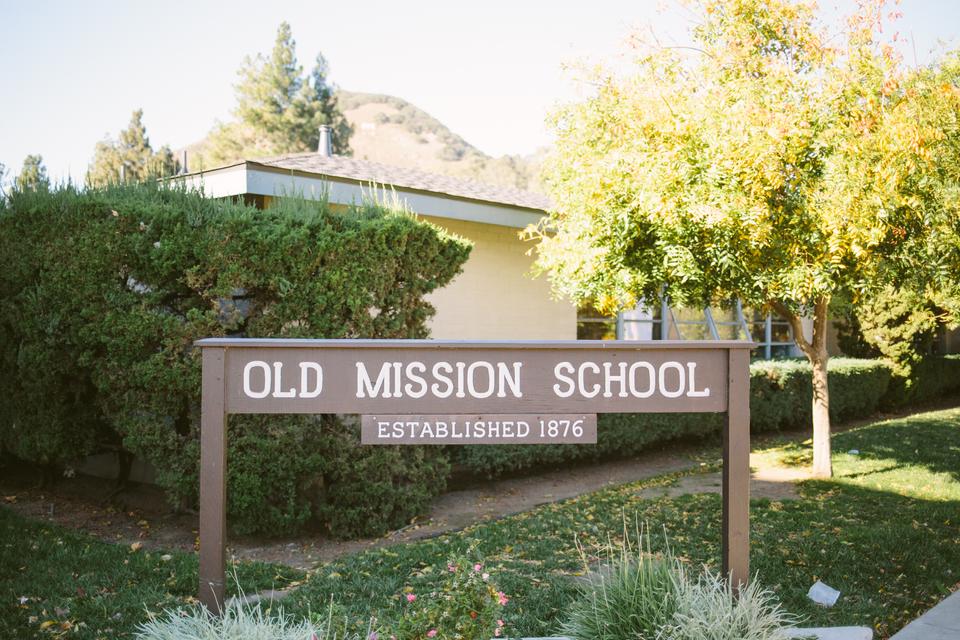
Old Mission School Photo
Gr: PK-8 | 330 students
Avg. class size: 35 students
Sports: 4 | Extracurriculars: 4
Catholic
761 Broad Street
San Luis Obispo, CA 93401
(805) 543-6019
Map of Orfalea Family & Asi Children's Center Rm # 133
Gr: PK-K | 119 students
Daycare / Preschool
1 Grand Ave
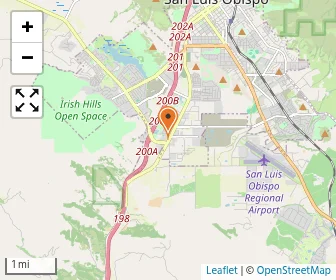
San Luis Obispo, CA 93407
(805) 756-1267
Map of St. Patrick Catholic School/Mercy Preschool
Gr: PK-8 | 308 students
Avg. class size: 26 students
Sports: 4 | Extracurriculars: 3
Catholic
900 W Branch St
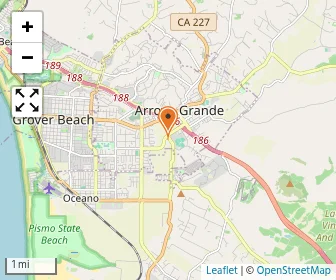
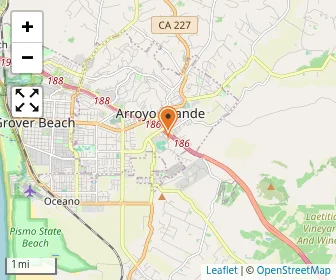
Arroyo Grande, CA 93420
(805) 489-1210
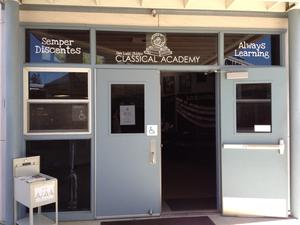
San Luis Obispo Classical Academy Photo
Gr: PK-12 | 394 students
Avg. class size: 16 students
Sports: 5 | Extracurriculars: 2
165 Grand Avenue
San Luis Obispo, CA 93405
(805) 548-8700
(2)
Templeton Hills7th-day Adventist School Photo
Gr: 1-8 | 9 students
Avg. class size: 9 students
Extracurriculars: 6
Seventh Day Adventist
940 Templeton Hills Rd
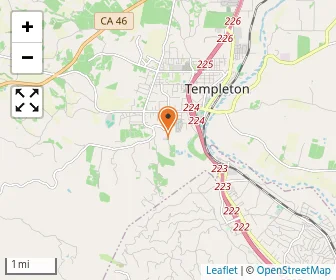
Templeton, CA 93465
(805) 434-1638
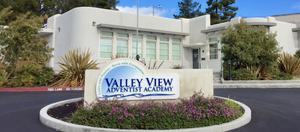
Valley View Adventist Junior Academy Photo
Gr: K-8 | 66 students
Avg. class size: 13 students
Sports: 4 | Extracurriculars: 3
Seventh Day Adventist
230 Vernon Street
Arroyo Grande, CA 93420
(805) 489-2687
Map of Acts Advanced Christian Training Schools
Gr: K-12 | 34 students
Avg. class size: 5 students
Lutheran Church Missouri Synod
P.O. Box 1677
Atascadero, CA 93423
(805) 242-6053
Map of Arroyo Grande Montessori School
Gr: PK-K | 14 students
Montessori School
216 Oak St
Arroyo Grande, CA 93420
(805) 473-2979
(1)
Map of Childrens House Montessori School
Gr: PK-6 | 147 students
Avg. class size: 20 students
Montessori School
3025 Monterey Rd
Atascadero, CA 93422
(805) 466-5068
Map of Dandy Lion Montessori School
Gr: PK-K | 42 students
Montessori School
1089 Baden Ave
Grover Beach, CA 93433
(805) 481-1735
Map of Lighthouse Christian School
Gr: K-12 | 38 students
Pentecostal
497 Fair Oaks Ave
Arroyo Grande, CA 93420
(805) 481-4673
Map of Lindamood Bell Academy
Gr: 3-12 | 35 students
416 Higuera St
San Luis Obispo, CA 93401
(805) 541-3836
Map of Lindamood-bell Learning Processes Berkeley
Gr: 2-8 | 3 students
Special Education School
1625 Shattuck Ave Ste 250
Berkeley, CA 94709
(510) 649-7618
Map of Montessori Childrens School
Gr: PK-6 | 86 students
Montessori School
4200 S Higuera St
San Luis Obispo, CA 93401
(805) 544-6691
North County Christian School Photo
Gr: PK-8 | 137 students
Avg. class size: 14 students
Extracurriculars: 5
Christian
6225 Atascadero Mall
Atascadero, CA 93422
(805) 466-4457
Map of St. Rose Catholic School
Gr: PK-8 | 256 students
Catholic
900 Tucker Ave
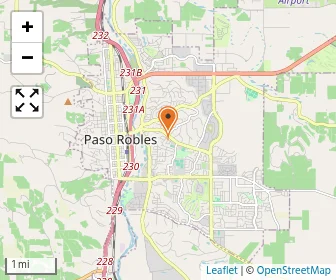
Paso Robles, CA 93446
(805) 238-0304
(2)
Map of San Luis Obispo Christian Academy
Gr: K-6 | 43 students
Christian
2075 Johnson Ave
San Luis Obispo, CA 93401
(805) 543-1146
Map of Santa Lucia School
Gr: K-8 | 28 students
Alternative School
1460 Plum Orchard Ln
Templeton, CA 93465
(805) 434-2217
Trinity Lutheran School Photo
Gr: PK-2 | 53 students
Avg. class size: 18 students
Sports: 2
Lutheran Church Missouri Synod
940 Creston Rd
Paso Robles, CA 93446
(805) 238-0335
Map of Wishing Well School
Gr: PK-8 | 134 students
880 Manzanita Dr
Los Osos, CA 93402
(805) 235-4401
[+] Show Closed Private Schools in San Luis Obispo County, California

San Luis Obispo County Private Schools (Closed)

Map of Central Coast Montessori School
Gr: NS-PK | 41 students
Montessori School
600 Quintana Road
Morro Bay, CA 93442
(805) 772-9317
Map of Heartland Christian Academy
Gr: K-8
Christian
Po Box 1674
Morro Bay, CA 93443
(805) 995-1941
Map of Pacific Coast Christian School
Gr: K | 68 students
Daycare / Preschool (Assembly of God)
207 Pilgrim Way
Arroyo Grande, CA 93420
(805) 474-1074
Map of San Luis Obispo Christian School
Gr: K-6 | 36 students
Christian
51 W Foothill Blvd
San Luis Obispo, CA 93405
(805) 543-6546

Overview

Category
This State (CA)
US
# Schools
24 Schools

Showing 2016–2025. Full 11-year historical data available below ↓

Private schools down 4 in San Luis Obispo County, falling from 28 in 2016 to 24 in 2025.
# Students
2,957 Students
659,615 Students

Showing 2016–2025. Full 11-year historical data available below ↓

Average students up 3 in San Luis Obispo County private schools, rising from 120 in 2016 to 123 in 2025.
% Average Students of Color
20%
52%

Showing 2016–2025. Full 11-year historical data available below ↓

Students of color down 2 points in San Luis Obispo County private schools, from 22% in 2016 to 20% in 2025.

Academics and Faculty:

# Teachers
246 Teachers
55,836 Teachers
Average Student-Teacher Ratio
12:1
12:1

Showing 2016–2025. Full 11-year historical data available below ↓

Student-teacher ratio down 1 in San Luis Obispo County, from 13:1 in 2024 to 12:1 in 2025.
% Average Faculty w/Advanced Degree
49%
60%

Showing 2016–2025. Full 11-year historical data available below ↓

Faculty advanced degrees up 2 points in San Luis Obispo County private schools, from 47% in 2016 to 49% in 2025, after peaking at 60% in 2021.
Average Class Size
17 students
17 students

Showing 2016–2025. Full 11-year historical data available below ↓

Average Number of AP Courses
8 courses
15 courses
Average SAT score
1260
(Out of 1600)
1267

Tuition and Acceptance Rate:

Average Yearly Tuition Cost
$11,440
$17,625

Showing 2016–2025. Full 11-year historical data available below ↓

Tuition up $1,817 in San Luis Obispo County, rising from $9,623 in 2016 to $11,440 in 2025.
Average % on Financial Aid
31%
29%

Showing 2016–2025. Full 11-year historical data available below ↓

Average Financial Aid Grant
$2,118
$9,632

Showing 2016–2025. Full 11-year historical data available below ↓

Average Acceptance Rate
91%
83%

Showing 2016–2025. Full 11-year historical data available below ↓

Students by Ethnicity:

0.59
0.74

Showing 2016–2025. Full 11-year historical data available below ↓

Diversity score up slightly in San Luis Obispo County private schools, rising from 0.57 in 2016 to 0.59 in 2025.
# American Indian Students
43 Students
3,574 Students
% American Indian Students
1%
1%
# Asian Students
107 Students
71,777 Students
% Asian Students
4%
11%

Showing 2016–2025. Full 11-year historical data available below ↓

County Asian share up 1 point from 2% in 2016 to 3% in 2025, while California rose from 10% to 11%.
# Hispanic Students
227 Students
104,405 Students
% Hispanic Students
7%
16%

Showing 2016–2025. Full 11-year historical data available below ↓

Hispanic share down 3 points in San Luis Obispo County private schools, from 10% in 2016 to 7% in 2025.
# Black Students
58 Students
30,221 Students
% Black Students
2%
5%

Showing 2016–2025. Full 11-year historical data available below ↓

Black students up 1 point in San Luis Obispo County private schools, rising from 1% in 2016 to 2% in 2025.
# White Students
1,773 Students
235,730 Students
% White Students
57%
37%

Showing 2016–2025. Full 11-year historical data available below ↓

White students down 2 points in San Luis Obispo County private schools, from 59% in 2018 to 57% in 2025.
# Hawaiian Students
7 Students
5,499 Students
% Hawaiian Students
<1%
1%
# Others Students
894 Students
188,740 Students
% of Others Students
29%
29%

Showing 2016–2025. Full 11-year historical data available below ↓

Other-race share down 1 point in San Luis Obispo County private schools, from 30% in 2016 to 29% in 2025.
All Ethnic Groups

Extracurriculars and Sports:

Average Number of Extracurriculars
4 extracurriculars
9 extracurriculars
Average Number of Sports
4 sports
7 sports

Frequently Asked Questions

What are the top ranked private schools in San Luis Obispo County, CA?
The top ranked private schools in San Luis Obispo County, CA include Christ Classical School, Coastal Christian School, and Old Mission School.
How many private schools are located in San Luis Obispo County?
23 private schools are located in San Luis Obispo County.
How much do private schools cost in San Luis Obispo County?
The average tuition cost is $11,440, which is lower than the California private school average tuition cost of $17,625.
How diverse are private schools in San Luis Obispo County?
San Luis Obispo County private schools are approximately 20% minority students, which is lower than the California private school average of 52%.
What percentage of students in San Luis Obispo County go to private school?
8% of all K-12 students in San Luis Obispo County are educated in private schools (compared to the CA state average of 10%).
What percentage of private schools are religiously affiliated in San Luis Obispo County?
58% of private schools in San Luis Obispo County are religiously affiliated (most commonly Catholic and Christian).
Which private schools in San Luis Obispo County are often viewed compared to one another?

Recent Articles

When a Private School Changes Head of School
A private school leadership change can raise important questions. Learn how to evaluate head of school transitions, identify warning signs, and protect your child's educational experience before enrolling confidently.
Private School Financial Aid Renewal: Could Awards Shrink?
Could your private school financial aid shrink next year? Learn why awards change, how income and school budgets affect renewal, and what parents can do to protect affordability long-term.
Need-Blind vs. Need-Aware Private School Admissions
Understand how need-blind and need-aware private school admissions affect acceptance decisions, financial aid eligibility, and affordability, with practical guidance to help parents compare schools, ask questions, and plan confidently ahead.

Filter Schools

School Level
Must Offer Grade
Show more
Gender
School Focus
Religious Affiliation
ADD/ADHD Support
Summer Program

Quick Links