Barnstable County Private Schools

For the 2026-27 school year, there are 18 private schools serving 2,589 students in Barnstable County, MA (there are 51 public schools, serving 23,014 public students). 10% of all K-12 students are educated in private schools (compared to the MA state average of 12%).
The average acceptance rate is 72%, which is higher than the Massachusetts private school average acceptance rate of 70%.
32% of private schools in Barnstable County, MA are religiously affiliated (most commonly Catholic and Other).

Quick Facts (26-27)

  • # Private Schools: 18
  • # Students Served: 2,589
  • Average Tuition: $26,703
  • % Students on Financial Aid: 44%
  • Acceptance Rate: 72%
  • Average Class Size: 13 students
  • % Students of Color: 12%
  • View Barnstable County, MA School Trends
Quick Facts (26-27)

  • # Private Schools: 18
  • # Students Served: 2,589
  • Average Tuition: $26,703
  • % Students on Financial Aid: 44%
  • Acceptance Rate: 72%
  • Average Class Size: 13 students
  • % Students of Color: 12%
  • View Barnstable County, MA School Trends
Top Ranked Barnstable County Private Schools (2026-27)

Cape Cod Academy Photo
Gr: K-12 | 276 students
Avg. class size: 13 students
Sports: 10 | Extracurriculars: 21
50 Osterville West Barnstable Road
Osterville, MA 02655
(508) 428-5400
(3)
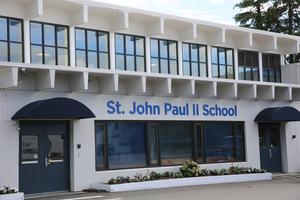
St. John Paul Ii School Photo
Gr: 5-12 | 367 students
Avg. class size: 15 students
Sports: 15
Catholic
120 High School Rd
Hyannis, MA 02601
(508) 862-6336
(1)
St. John Paul II School Photo
Gr: 5-12 | 424 students
Avg. class size: 15 students
Sports: 17 | Extracurriculars: 39
Catholic
120 High School Rd
Hyannis, MA 02601
(508) 862-6336
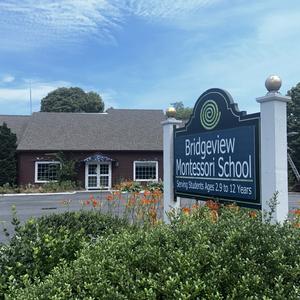
Bridgeview Montessori School Photo
Gr: NS-6 | 75 students
Avg. class size: 13 students
Montessori School
885 Sandwich Rd
Sagamore, MA 02561
(508) 888-3567
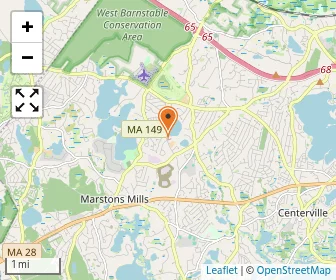
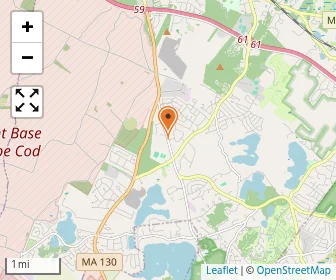
Map of Fair Acres Country Day School
Gr: PK-K | 100 students
Daycare / Preschool
35 Fair Acres Dr
Marstons Mills, MA 02648
(508) 420-3288
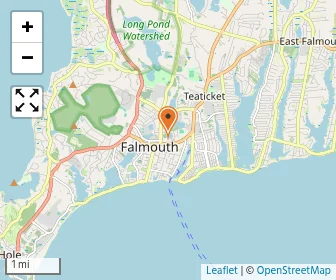
Falmouth Academy Photo
Gr: 7-12 | 180 students
Avg. class size: 12 students
Sports: 6 | Extracurriculars: 31
7 Highfield Dr.
Falmouth, MA 02540
(508) 457-9696
Map of The Family School; Salt Box School
Gr: PK-K | 69 students
3570 Main St
Brewster, MA 02631
(508) 896-6555
Map of The Hundred Acre School Heritage Museums And Gardens
Gr: PK-K | 43 students
Specialized Curriculum
67 Grove St
Sandwich, MA 02563
(508) 564-1430
Map of Latham School
Gr: 4-12 | 44 students
Special Education School
1646 Main St
Brewster, MA 02631
(774) 353-9255
Map of The Laurel School
Gr: PK-5 | 108 students
Extracurriculars: 15
Alternative School
1436 Long Pond Road
Brewster, MA 02631
(508) 896-4934
(2)
Map of Little Kids Inc
Gr: PK-K | 45 students
Daycare / Preschool
590 North Falmouth Hwy.
North Falmouth, MA 02556
(508) 563-7236
Map of Montessori Academy-cape Cod
Gr: PK-K | 14 students
Montessori School
81 Chester St
North Falmouth, MA 02556
(508) 563-9010
(1)
Map of Montessori Schools Of Sandwich
Gr: NS-6 | 91 students
Montessori School
284 Cotuit Rd
Sandwich, MA 02563
(508) 888-4222
Riverview School Inc Photo
Gr: 6-12 | 208 students
Avg. class size: 8 students
Sports: 26 | Extracurriculars: 7
Special Education School
551 Route 6A
East Sandwich, MA 02537
(508) 888-0489
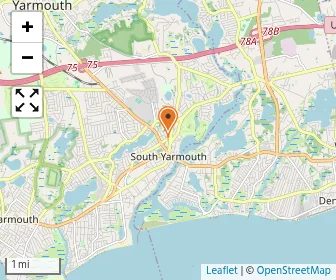
Map of St. Pius X School
Gr: PK-8 | 212 students
Sports: 7
Catholic
321 Wood Road
South Yarmouth, MA 02664
(508) 398-6112
Map of The Sunroom Montessori School
Gr: K | 7 students
Montessori School (Christian)
233 Old County Road
East Sandwich, MA 02537
(508) 468-0799
Trinity Christian Academy Photo
Gr: PK-12 | 188 students
Avg. class size: 15 students
Sports: 5 | Extracurriculars: 5
979 Mary Dunn Rd
Barnstable, MA 02630
(508) 790-0114
West Parish Family School Photo
Gr: NS | 88 students
Daycare / Preschool (Church of Christ)
2049 Meetinghouse Way (Route 149 and Exit 5
West Barnstable, MA 02668
(508) 362-4967
[+] Show Closed Private Schools in Barnstable County, Massachusetts

Barnstable County Private Schools (Closed)

Map of Academy Of Early Learning
Gr: PK-1 | 38 students
Daycare / Preschool
465 Falmouth Rd
Hyannis, MA 02601
(508) 790-8104
Map of Bayberry Christian School
Gr: 1-3 | 7 students
Seventh Day Adventist
2736 Falmouth Road Osterville,
Osterville, MA 02655
(508) 428-9178
Map of The Childrens Workshop
Gr: PK-1 | 79 students
Daycare / Preschool
536 Macarthur Blvd
Buzzards Bay, MA 02532
(508) 563-3400
Map of Faith Christian Academy
Gr: PK-4 | 31 students
Christian
270 Communication Way Unit 3
Hyannis, MA 02601
(508) 771-5350
Map of Holy Trinity School
Gr: NS-5 | 75 students
Avg. class size: 17 students
Catholic
245 Route 28
West Harwich, MA 02671
(508) 432-8216
Map of The Partnership School Of Cape Cod
Gr: PK-K | 29 students
Daycare / Preschool
17 Nells Way
Orleans, MA 02653
(774) 801-2287
Map of Penikese Island School
Gr: 8-10 | 6 students
Avg. class size: 4 students
All-boys | Special Education School
565 Woods Hole Rd
Woods Hole, MA 02543
(508) 548-7276
St. Margaret Primary School Photo
Gr: PK-4 | 59 students
Avg. class size: 12 students
Catholic
143 Main Street
Buzzards Bay, MA 02532
(508) 759-2213
(2)
Waldorf School Of Cape Cod Photo
Gr: PK-7 | 116 students
Avg. class size: 12 students
Specialized Curriculum
140 Old Oyster Rd
Cotuit, MA 02635
(508) 420-1005

Overview

Category
This State (MA)
US
# Schools
19 Schools

Showing 2016–2025. View full 11-year historical data

The number of private schools in Barnstable County fell from 28 in 2016 to 19 in 2025.
# Students
2,589 Students
126,139 Students

Showing 2016–2025. View full 11-year historical data

Average private school enrollment per school in Barnstable County rose from 92 in 2016 to 136 in 2025, though it remained 43 below the Massachusetts average.
% Average Students of Color
12%
32%

Showing 2016–2025. View full 11-year historical data

The average percentage of students of color in Barnstable County private schools was 12% in 2025, 22 points lower than Massachusetts at 31%.

Academics and Faculty:

# Teachers
289 Teachers
15,776 Teachers
Average Student-Teacher Ratio
9:1
8:1

Showing 2016–2025. View full 11-year historical data

The average student-teacher ratio in Barnstable County was 9:1 in 2025, one student lower per teacher than the 11:1 national ratio.
% Average Faculty w/Advanced Degree
66%
68%
Average Class Size
13 students
14 students
Average Number of AP Courses
10 courses
16 courses
Average SAT score
1228
(Out of 1600)
1289

Tuition and Acceptance Rate:

Average Yearly Tuition Cost
$26,703
$29,201
Average Summer Program Cost
$7,019
$2,798
Average % on Financial Aid
44%
37%
Average Financial Aid Grant
$7,578
$18,694
Average Acceptance Rate
72%
70%
Average Endowment Size
$16.84 million
$108.53 million

Students by Ethnicity:

0.53
0.63

Showing 2016–2025. View full 11-year historical data

Average diversity score in Barnstable County was 0.53 in 2025, below Massachusetts at 0.63 and the United States at 0.65.
# American Indian Students
6 Students
187 Students
% American Indian Students
<1%
<1%
# Asian Students
71 Students
6,791 Students
% Asian Students
3%
5%

Showing 2016–2025. View full 11-year historical data

# Hispanic Students
72 Students
7,564 Students
% Hispanic Students
3%
6%

Showing 2016–2025. View full 11-year historical data

# Black Students
31 Students
8,693 Students
% Black Students
1%
7%

Showing 2016–2025. View full 11-year historical data

# White Students
1,632 Students
67,896 Students
% White Students
61%
55%

Showing 2016–2025. View full 11-year historical data

# Hawaiian Students
0 Students
83 Students
% Hawaiian Students
0%
<1%
# Others Students
848 Students
33,194 Students
% of Others Students
32%
27%

Showing 2016–2025. View full 11-year historical data

All Ethnic Groups

Extracurriculars and Sports:

Average Number of Extracurriculars
20 extracurriculars
13 extracurriculars
Average Number of Sports
12 sports
9 sports

Frequently Asked Questions

What are the top ranked private schools in Barnstable County, MA?
The top ranked private schools in Barnstable County, MA include Cape Cod Academy, St. John Paul Ii School, and St. John Paul II School.
How many private schools are located in Barnstable County?
18 private schools are located in Barnstable County.
How diverse are private schools in Barnstable County?
Barnstable County private schools are approximately 12% minority students, which is lower than the Massachusetts private school average of 32%.
What percentage of students in Barnstable County go to private school?
10% of all K-12 students in Barnstable County are educated in private schools (compared to the MA state average of 12%).
What percentage of private schools are religiously affiliated in Barnstable County?
32% of private schools in Barnstable County are religiously affiliated (most commonly Catholic and Other).
Which private schools in Barnstable County are often viewed compared to one another?

Recent Articles

When Your Child Is Excluded From Private School Events
Learn how to support your child when excluded from private school birthday parties and social events, recognize bullying, communicate with teachers, encourage friendships, and address repeated exclusion with confidence.
Private School Scholarship Renewal Requirements
Learn what students must do to keep private school scholarships, including academic performance, attendance, conduct, extracurricular commitments, renewal deadlines, and how parents can protect tuition assistance throughout their education.
Private School Deposits: What If You Change Schools?
Learn what happens to your private school enrollment deposit when your child accepts another offer, including refund policies, contract obligations, withdrawal deadlines, and practical steps to minimize financial losses.

Filter Schools

School Level
Must Offer Grade
Show more
Gender
School Focus
Religious Affiliation
ADD/ADHD Support
Summer Program

Quick Links