Norfolk County Private Schools

For the 2026-27 school year, there are 118 private schools serving 20,000 students in Norfolk County, MA (there are 188 public schools, serving 98,336 public students). 17% of all K-12 students are educated in private schools (compared to the MA state average of 12%).
The average tuition cost is $29,141, which is higher than the Massachusetts private school average tuition cost of $26,644.
34% of private schools in Norfolk County, MA are religiously affiliated (most commonly Catholic and Jewish).

Quick Facts (26-27)

  • # Private Schools: 118
  • # Students Served: 20,000
  • Average Tuition: $29,141
  • % Students on Financial Aid: 36%
  • Acceptance Rate: 69%
  • Average Class Size: 14 students
  • % Students of Color: 32%
  • View Norfolk County, MA School Trends
Quick Facts (26-27)

  • # Private Schools: 118
  • # Students Served: 20,000
  • Average Tuition: $29,141
  • % Students on Financial Aid: 36%
  • Acceptance Rate: 69%
  • Average Class Size: 14 students
  • % Students of Color: 32%
  • View Norfolk County, MA School Trends
Top Ranked Norfolk County Private Schools (2026-27)

Dana Hall School Photo
Gr: 5-12 | 441 students
Avg. class size: 12 students
Sports: 16 | Extracurriculars: 36
All-girls
45 Dana Road
Wellesley, MA 02482
(781) 489-1331
(1)
Dedham Country Day School Photo
Gr: PK-8 | 309 students
Avg. class size: 12 students
Sports: 11 | Extracurriculars: 5
90 Sandy Valley Road
Dedham, MA 02026
(781) 329-0850
(1)
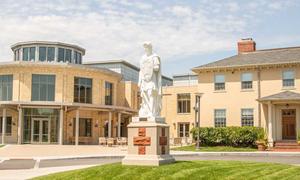
Delphi Academy of Boston Photo
Gr: PK-8 | 140 students
Avg. class size: 12 students
Sports: 3 | Extracurriculars: 4
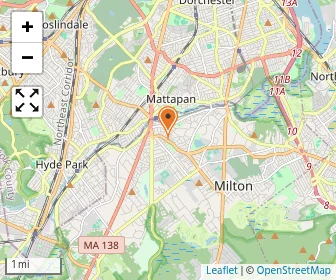
564 Blue Hill Avenue
Milton, MA 02186
(617) 333-9610
(8)
The Sage School Photo
Gr: NS-8 | 135 students
Avg. class size: 12 students
Extracurriculars: 7
Specialized Curriculum
171 Mechanic St
Foxboro, MA 02035
(508) 543-9619
(12)
The Woodward School Photo
Gr: 6-12 | 75 students
Avg. class size: 8 students
Sports: 5 | Extracurriculars: 22
All-girls
1102 Hancock St
Quincy, MA 02169
(617) 773-5610
(7)
Archbishop Williams High School Photo
Gr: 7-12 | 648 students
Avg. class size: 20 students
Sports: 17 | Extracurriculars: 1
Catholic
40 Independence Ave
Braintree, MA 02184
(781) 535-6051
(1)
Blessed Sacrament School Photo
Gr: NS-8 | 319 students
Avg. class size: 14 students
Sports: 7 | Extracurriculars: 8
Catholic
808 East Street
Walpole, MA 02081
(508) 668-2336
(4)
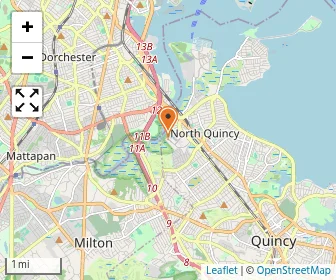
Map of Blue Cross Blue Shield Ma Center For Children
Gr: K | 27 students
Daycare / Preschool
1 Enterprise Dr
Quincy, MA 02171
(617) 246-8002
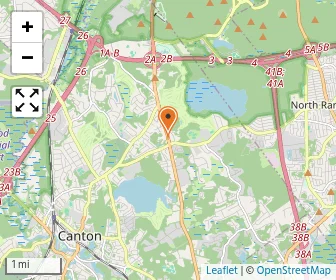
Map of The Blue Hill Montessori School
Gr: PK-K | 57 students
Avg. class size: 20 students
Extracurriculars: 4
Montessori School
163 Turnpike Street
Canton, MA 02021
(781) 828-5230
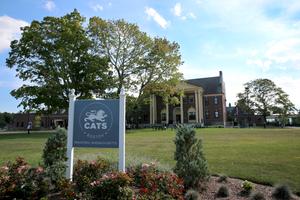
Cats Academy Photo
Gr: 8-12 | 327 students
Avg. class size: 12 students
Specialized Curriculum
2001 Washington Street
Braintree, MA 02184
(857) 400-9700
Charles River School Photo
Gr: PK-8 | 190 students
Avg. class size: 18 students
Sports: 9 | Extracurriculars: 7
6 Old Meadow Road
Dover, MA 02030
(508) 785-8213
(10)
Map of Clark School Boston
Gr: NS-2 | 24 students
Avg. class size: 8 students
Special Education School
1 Whitman Road, Canton
Canton, MA 02021
(281) 821-3499
Map of Dba:clarke School Boston
Gr: Inquire with school | 20 students
Special Education School
1 Whitman Rd
Canton, MA 02021
(781) 821-3499
Dexter Southfield School Photo
Gr: NS-12 | 1,027 students
Sports: 19 | Extracurriculars: 37
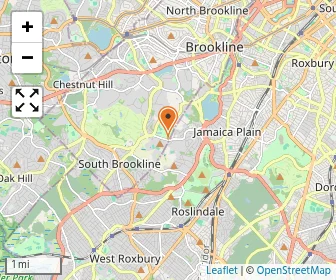
20 Newton St
Brookline, MA 02445
(617) 522-5544
(1)
Fontbonne Photo
Gr: 7-12 | 340 students
Avg. class size: 15 students
Sports: 12 | Extracurriculars: 18
All-girls (Catholic)
930 Brook Road
Milton, MA 02186
(617) 615-3014
League School for Autism Photo
Gr: PK-12 | 110 students
Avg. class size: 7 students
Special Education School
300 Boston Providence Turnpike
Walpole, MA 02032
(508) 850-3900
Maimonides School Elementary Section Photo
Gr: PK-12 | 363 students
Sports: 6 | Extracurriculars: 10
Specialized Curriculum (Jewish)
34 Philbrick Rd
Brookline, MA 02445
(617) 232-4452
Milton Academy Photo
Gr: K-12 | 1,020 students
Avg. class size: 14 students
Sports: 19 | Extracurriculars: 56
170 Centre Street
Milton, MA 02186
(617) 898-1798
Montrose School Photo
Gr: 6-12 | 277 students
Avg. class size: 15 students
Sports: 9 | Extracurriculars: 24
All-girls (Catholic)
29 North Street
Medfield, MA 02052
(508) 359-2423
(1)
Map of Noble And Greenough School
Gr: 7-12 | 620 students
Avg. class size: 13 students
Sports: 18
10 Campus Drive
Dedham, MA 02026
(781) 320-7271
Norwood Montessori School Photo
Gr: PK-12 | 100 students
Extracurriculars: 2
Montessori School
462 Walpole St
Norwood, MA 02062
(781) 762-3700
The Park School Photo
Gr: PK-8 | 568 students
Avg. class size: 14 students
Sports: 12 | Extracurriculars: 15
171 Goddard Avenue
Brookline, MA 02445
(617) 277-2456
(1)
Map of Quincy Catholic Academy
Gr: PK-8 | 378 students
Avg. class size: 20 students
Sports: 1
Catholic
370 Hancock St
Quincy, MA 02171
(617) 328-3830
(2)
Sacred Heart Continuation School Photo
Gr: PK-8 | 229 students
Extracurriculars: 3
Catholic
75 Commercial St
Weymouth, MA 02188
(781) 335-6010
(2)
St. Agatha School Photo
Gr: PK-8 | 417 students
Sports: 3 | Extracurriculars: 15
Catholic
440 Adams Street
Milton, MA 02186
(617) 696-3548
Map of St. Ann School
Gr: K-9 | 299 students
Catholic
1 Saint Anns Rd
Quincy, MA 02170
(617) 471-9071
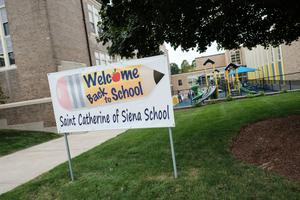
St. Catherine Of Siena School Photo
Gr: PK-8 | 411 students
Avg. class size: 17 students
Sports: 4 | Extracurriculars: 6
Catholic
249 Nahatan St
Norwood, MA 02062
(781) 769-5354
(2)
Map of St. John The Evangelist School
Gr: NS-8 | 256 students
Avg. class size: 24 students
Extracurriculars: 3
Catholic
696 Washington St
Canton, MA 02021
(781) 828-2130
(1)
Map of Saint Joseph School
Gr: NS-8 | 417 students
Avg. class size: 16 students
Sports: 14 | Extracurriculars: 6
Catholic
90 Pickering Street
Needham, MA 02492
(781) 444-4459
(1)
St. Mary Of The Assumption School Photo
Gr: PK-8 | 265 students
Avg. class size: 15 students
Sports: 2 | Extracurriculars: 1
Catholic
67 Harvard St
Brookline, MA 02445
(617) 566-7184
(4)
Map of St. Mary Of The Hills School
Gr: PK-8 | 326 students
Catholic
250 Brook Rd
Milton, MA 02186
(617) 698-2464
St. Sebastians School Photo
Gr: 7-12 | 390 students
Avg. class size: 10 students
Sports: 14 | Extracurriculars: 28
All-boys (Catholic)
1191 Greendale Avenue
Needham, MA 02492
(781) 247-0125
(12)
Map of SouthfieldSchool
Gr: NS-12 | 371 students
All-girls
10 Newton St
Brookline, MA 02445
(617) 522-6980
(1)
Tenacre Country Day School Photo
Gr: PK-6 | 204 students
Avg. class size: 12 students
Sports: 7 | Extracurriculars: 8
78 Benvenue Street
Wellesley, MA 02482
(781) 235-2282
(4)
Map of Thayer Academy
Gr: 5-12 | 686 students
Avg. class size: 15 students
745 Washington Street
Braintree, MA 02184
(781) 664-2201
Show 83 more private schools in Norfolk County, MA (out of 118 total schools)
Loading...
[+] Show Closed Private Schools in Norfolk County, Massachusetts

Norfolk County Private Schools (Closed)

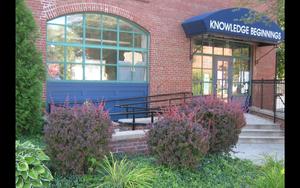
Brookline Knowledge Beginnings Photo
Gr: NS-PK
Daycare / Preschool
5 Brookline Place
Brookline, MA 02445
(617) 730-4311
Map of Kids Connection Learning Center
Gr: PK-K | 65 students
Daycare / Preschool
468 Hancock Street
Quincy, MA 02171
(617) 328-6329
Map of The Learning Center For Deaf Children
Gr: K-7 | 30 students
Special Education School
30 Seton Way
Randolph, MA 02368
(781) 963-5110
Map of Millis Country Day School
Gr: K | 21 students
Daycare / Preschool
210 Pleasant St
Millis, MA 02054
(508) 376-8425
Map of St. Joseph School
Gr: PK-8 | 170 students
Catholic
22 Pray Street
Quincy, MA 02169
(617) 773-8080
Map of St. Mary School
Gr: K-9 | 127 students
Catholic
121 Crescent St
Quincy, MA 02169
(617) 773-5237
Map of St. Paul School
Gr: NS-8 | 193 students
Avg. class size: 19 students
Catholic
10 Atwood St
Wellesley, MA 02482
(781) 235-1510
(2)

Overview

Category
This State (MA)
US
# Schools
124 Schools

Showing 2016–2025. Full 11-year historical data available below ↓

Private schools down 2 in Norfolk County, from 126 in 2024 to 124 in 2025, after peaking at 126.
# Students
20,000 Students
126,163 Students

Showing 2016–2025. Full 11-year historical data available below ↓

Average students steady in Norfolk County, with private schools at 173 in 2016 and 169 in 2025.
% Average Students of Color
32%
32%

Showing 2016–2025. Full 11-year historical data available below ↓

Students of color down 1 point in Norfolk County private schools, from 33% in 2016 to 32% in 2025.

Academics and Faculty:

# Teachers
2,490 Teachers
15,776 Teachers
Average Student-Teacher Ratio
8:1
8:1

Showing 2016–2025. Full 11-year historical data available below ↓

Student-teacher ratio lower in Norfolk County, improving from 9:1 in 2016 to 8:1 in 2025 and matching Massachusetts at 8:1.
% Average Faculty w/Advanced Degree
75%
68%

Showing 2016–2025. Full 11-year historical data available below ↓

Average Class Size
14 students
14 students

Showing 2016–2025. Full 11-year historical data available below ↓

Average Number of AP Courses
14 courses
16 courses

Showing 2016–2025. Full 11-year historical data available below ↓

Average SAT score
1296
(Out of 1600)
1289
SAT score stayed high in Norfolk County private schools, at 1286 in 2025 versus 1318 in 2017 and 1289 in Massachusetts.
Average ACT score
29
(Out of 36)
29

Tuition and Acceptance Rate:

Average Yearly Tuition Cost
$29,141
$26,644

Showing 2016–2025. Full 11-year historical data available below ↓

Tuition up 26% in Norfolk County, rising from $22,571 in 2016 to $28,586 in 2025.
Average Summer Program Cost
$525
$2,798
Average % on Financial Aid
36%
37%

Showing 2016–2025. Full 11-year historical data available below ↓

Financial aid up 10 points in Norfolk County private schools, rising from 27% in 2016 to 37% in 2025.
Average Financial Aid Grant
$27,231
$18,788

Showing 2016–2025. Full 11-year historical data available below ↓

Financial aid grant rose 70% in Norfolk County, from $15,379 in 2016 to $26,104 in 2025.
Average Acceptance Rate
69%
73%

Showing 2016–2025. Full 11-year historical data available below ↓

Average Endowment Size
$62.11 million
$94.31 million
Endowment down 17 million in Norfolk County, from $75 million in 2019 to $58 million in 2025.

Students by Ethnicity:

0.63
0.63

Showing 2016–2025. Full 11-year historical data available below ↓

Diversity score up 11 points in Norfolk County private schools, rising from 0.52 in 2016 to 0.63 in 2025.
# American Indian Students
51 Students
187 Students
% American Indian Students
<1%
<1%
# Asian Students
1,522 Students
6,791 Students
% Asian Students
8%
5%

Showing 2016–2025. Full 11-year historical data available below ↓

Asian share up 3 points in Norfolk County private schools, from 5% in 2016 to 8% in 2025.
# Hispanic Students
727 Students
7,564 Students
% Hispanic Students
4%
6%

Showing 2016–2025. Full 11-year historical data available below ↓

Hispanic enrollment rose 2 points in Norfolk County private schools, from 2% in 2016 to 4% in 2025, still below Massachusetts' 6% and the U.S.'s 9%.
# Black Students
1,272 Students
8,693 Students
% Black Students
7%
7%

Showing 2016–2025. Full 11-year historical data available below ↓

# White Students
10,455 Students
67,896 Students
% White Students
54%
55%

Showing 2016–2025. Full 11-year historical data available below ↓

White share down 13 points in Norfolk County private schools, from 67% in 2016 to 54% in 2025, matching Massachusetts at 54%.
# Hawaiian Students
5 Students
83 Students
% Hawaiian Students
<1%
<1%
# Others Students
5,225 Students
33,186 Students
% of Others Students
27%
27%

Showing 2016–2025. Full 11-year historical data available below ↓

Other-race share up 8 points in Norfolk County private schools, rising from 19% in 2016 to 27% in 2025.
All Ethnic Groups

Extracurriculars and Sports:

Average Number of Extracurriculars
11 extracurriculars
13 extracurriculars
Average Number of Sports
9 sports
9 sports

Frequently Asked Questions

What are the top ranked private schools in Norfolk County, MA?
The top ranked private schools in Norfolk County, MA include Dana Hall School, Dexter Southfield School, and Dedham Country Day School.
How many private schools are located in Norfolk County?
118 private schools are located in Norfolk County.
How much do private schools cost in Norfolk County?
The average tuition cost is $29,141, which is higher than the Massachusetts private school average tuition cost of $26,644.
How diverse are private schools in Norfolk County?
Norfolk County private schools are approximately 32% minority students, which is same as the Massachusetts private school average of 32%.
What percentage of students in Norfolk County go to private school?
17% of all K-12 students in Norfolk County are educated in private schools (compared to the MA state average of 12%).
What percentage of private schools are religiously affiliated in Norfolk County?
34% of private schools in Norfolk County are religiously affiliated (most commonly Catholic and Jewish).
Which private schools in Norfolk County are often viewed compared to one another?

Recent Articles

When a Private School Changes Head of School
A private school leadership change can raise important questions. Learn how to evaluate head of school transitions, identify warning signs, and protect your child's educational experience before enrolling confidently.
Private School Financial Aid Renewal: Could Awards Shrink?
Could your private school financial aid shrink next year? Learn why awards change, how income and school budgets affect renewal, and what parents can do to protect affordability long-term.
Need-Blind vs. Need-Aware Private School Admissions
Understand how need-blind and need-aware private school admissions affect acceptance decisions, financial aid eligibility, and affordability, with practical guidance to help parents compare schools, ask questions, and plan confidently ahead.

Filter Schools

School Level
Must Offer Grade
Show more
Gender
School Focus
Religious Affiliation
ADD/ADHD Support
Summer Program

Quick Links