Whatcom County Private Schools

For the 2026-27 school year, there are 22 private schools serving 4,941 students in Whatcom County, WA (there are 78 public schools, serving 27,692 public students). 15% of all K-12 students are educated in private schools (compared to the WA state average of 10%).
The average acceptance rate is 91%, which is higher than the Washington private school average acceptance rate of 85%.
45% of private schools in Whatcom County, WA are religiously affiliated (most commonly Christian and Catholic).

Quick Facts (26-27)

  • # Private Schools: 22
  • # Students Served: 4,941
  • Average Tuition: $8,781
  • % Students on Financial Aid: 33%
  • Acceptance Rate: 91%
  • Average Class Size: 17 students
  • % Students of Color: 13%
  • View Whatcom County, WA School Trends
Quick Facts (26-27)

  • # Private Schools: 22
  • # Students Served: 4,941
  • Average Tuition: $8,781
  • % Students on Financial Aid: 33%
  • Acceptance Rate: 91%
  • Average Class Size: 17 students
  • % Students of Color: 13%
  • View Whatcom County, WA School Trends
Top Ranked Whatcom County Private Schools (2026-27)

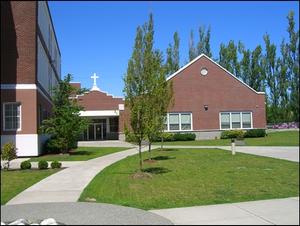
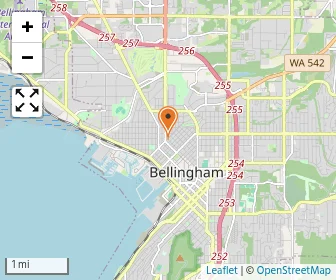
Assumption Catholic School Photo
Gr: PK-8 | 259 students
Avg. class size: 25 students
Sports: 6 | Extracurriculars: 1
Catholic
2116 Cornwall Ave
Bellingham, WA 98225
(360) 733-6133
(3)
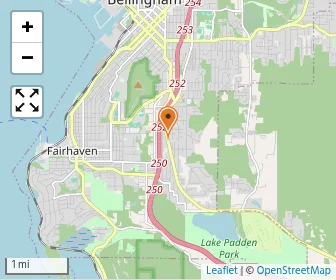
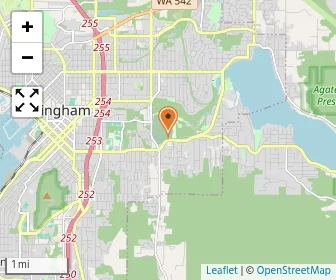
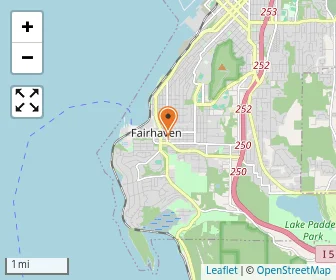
Map of Bellingham Christian School
Gr: PK-8 | 378 students
Avg. class size: 20 students
Sports: 3 | Extracurriculars: 1
Christian
1600 E Sunset Dr
Bellingham, WA 98226
(360) 733-7303
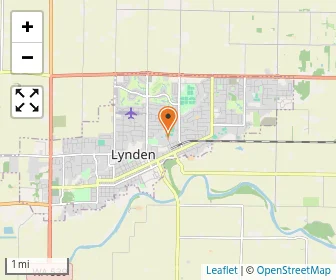
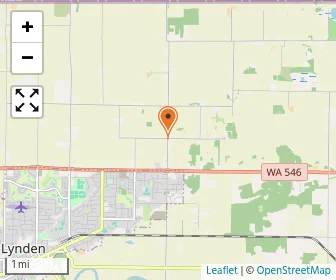
Map of Ebenezer Christian School
Gr: PK-8 | 180 students
Avg. class size: 18 students
Sports: 3
Christian
9390 Guide Meridian Rd
Lynden, WA 98264
(360) 354-2632
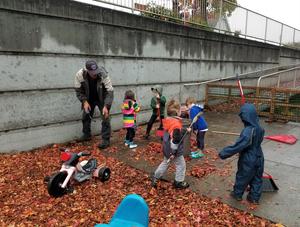
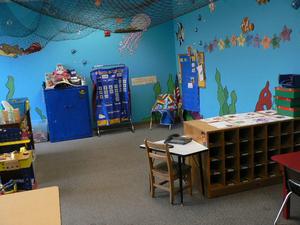
Explorations Academy Photo
Gr: 6-12 | 48 students
Avg. class size: 10 students
Alternative School
1701 Ellis St # 215
Bellingham, WA 98225
(360) 671-8085
(3)
Map of The Franklin Academy
Gr: NS-8 | 442 students
Sports: 4
1509 E. Victor Street
Bellingham, WA 98225
(360) 733-1750
Map of Lynden Christian School
Gr: PK-12 | 1,210 students
Sports: 9 | Extracurriculars: 6
Christian
417 Lyncs Dr
Lynden, WA 98264
(360) 354-5492
Map of Lynden Christian Schools: Administration
Gr: PK-12 | 1,311 students
Christian
515 Drayton St
Lynden, WA 98264
(360) 318-9525
Map of Montessori At Samish Woods
Gr: PK-6 | 78 students
Avg. class size: 24 students
Montessori School
1027 Samish Way
Bellingham, WA 98229
(360) 650-9465
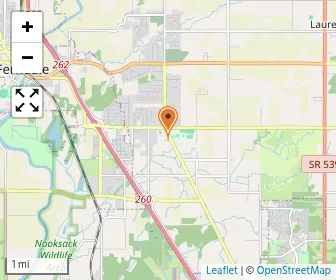
Map of Pioneer Meadows Montessori School
Gr: PK-6 | 82 students
Avg. class size: 25 students
Montessori School
2377 Douglas Road
Ferndale, WA 98248
(360) 788-3681
Map of Alger Learning Center & Independence High School
Gr: PK-12
Alternative School
100 Pine Street Ste. 103
Bellingham, WA 98225
(360) 595-2630
Map of Blossom Childcare & Learning Center
Gr: PK-K | 30 students
Daycare / Preschool
2945 Douglas Ave
Bellingham, WA 98225
(360) 752-2699
Map of Blue Heron Montessori School
Gr: PK-K | 42 students
Montessori School
920 24th St
Bellingham, WA 98225
(360) 306-3669
Map of Cascades Montessori Middle School
Gr: 7-8 | 25 students
Montessori School
2710 Mckenzie Ave
Bellingham, WA 98225
(360) 306-8723
Map of Catch The Son Preschool
Gr: NS-PK | 62 students
Avg. class size: 12 students
Daycare / Preschool (Evangelical Lutheran Church in America (formerly AELC, ALC, or LCA))
2600 Lakeway Drive
Bellingham, WA 98229
(360) 733-1277
Map of Cedar Tree Montessori
Gr: PK-6 | 79 students
Avg. class size: 24 students
Montessori School
2114 Broadway
Bellingham, WA 98225
(360) 714-1762
Map of Covenant Christian School
Gr: K-8 | 29 students
9088 Northwood Rd
Lynden, WA 98264
(360) 354-5436
Gardenview Montessori Photo
Gr: PK-K | 80 students
Avg. class size: 10 students
Montessori School
2117 Walnut St.
Bellingham, WA 98225
(360) 527-9638
Map of Hillcrest Kids
Gr: NS-5 | 187 students
Daycare / Preschool (Assembly of God)
1400 Larrabee Avenue
Bellingham, WA 98225
(360) 733-8135
Lynden Christian School Evergreen Campus Photo
Gr: PK-4 | 61 students
Avg. class size: 12 students
Specialized Curriculum (Calvinist)
567 E. Kellogg Road
Bellingham, WA 98226
(360) 988-3473
Map of Trinity Classical School
Gr: K-8 | 112 students
Specialized Curriculum (Presbyterian)
2826 Birchwood Ave
Bellingham, WA 98225
(360) 733-2695
Map of Whatcom Academy
Gr: PK-5 | 9 students
Avg. class size: 5 students
5217 Northwest Dr.
Bellingham, WA 98226
(360) 299-5000
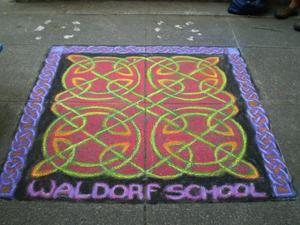
Whatcom Hills Waldorf School Photo
Gr: PK-8 | 237 students
Avg. class size: 20 students
Specialized Curriculum
941 Austin St
Bellingham, WA 98229
(360) 733-3164
(4)
[+] Show Closed Private Schools in Whatcom County, Washington

Whatcom County Private Schools (Closed)

Providence Christian School NW Photo
Gr: PK-12 | 59 students
Avg. class size: 12 students
Christian
5950 Portal Way
Ferndale, WA 98248
(360) 318-1347
Map of St. Paul's Academy
Gr: PK-8 | 273 students
Avg. class size: 10 students
Specialized Curriculum (Christian)
1509 E. Victor Street
Bellingham, WA 98225
(360) 733-1750
(1)

Overview

Category
This State (WA)
US
# Schools
22 Schools

Showing 2016–2025. Full 11-year historical data available below ↓

Private schools down 2 in Whatcom County, from 24 in 2016 to 22 in 2025.
# Students
4,941 Students
118,587 Students

Showing 2016–2025. Full 11-year historical data available below ↓

Average students up 86 in Whatcom County private schools, rising from 150 in 2016 to 236 in 2025.
% Average Students of Color
13%
32%

Showing 2016–2025. Full 11-year historical data available below ↓

Academics and Faculty:

# Teachers
375 Teachers
9,998 Teachers
Average Student-Teacher Ratio
12:1
12:1

Showing 2016–2025. Full 11-year historical data available below ↓

Student-teacher ratio rose 1 in Whatcom County private schools, from 11:1 in 2021 to 12:1 in 2025.
% Average Faculty w/Advanced Degree
44%
59%
Average Class Size
17 students
15 students

Showing 2016–2025. Full 11-year historical data available below ↓

Average SAT score
1450
(Out of 1600)
1274

Tuition and Acceptance Rate:

Average Yearly Tuition Cost
$8,781
$15,225

Showing 2016–2025. Full 11-year historical data available below ↓

Tuition rose 26% in Whatcom County, from $6,837 in 2016 to $8,613 in 2025, still below Washington and the U.S.
Average % on Financial Aid
33%
28%
Financial aid up 18 points in Whatcom County private schools, rising from 15% in 2015 to 33% in 2025.
Average Financial Aid Grant
$3,625
$9,416
Average Acceptance Rate
91%
85%

Students by Ethnicity:

0.52
0.64

Showing 2016–2025. Full 11-year historical data available below ↓

Diversity score up slightly in Whatcom County private schools, rising from 0.45 in 2020 to 0.52 in 2025.
# American Indian Students
31 Students
1,226 Students
% American Indian Students
1%
1%

Showing 2016–2025. Full 11-year historical data available below ↓

# Asian Students
208 Students
9,040 Students
% Asian Students
4%
8%

Showing 2016–2025. Full 11-year historical data available below ↓

# Hispanic Students
145 Students
6,302 Students
% Hispanic Students
3%
5%

Showing 2016–2025. Full 11-year historical data available below ↓

# Black Students
60 Students
3,815 Students
% Black Students
1%
3%

Showing 2016–2025. Full 11-year historical data available below ↓

# White Students
3,179 Students
59,127 Students
% White Students
64%
50%

Showing 2016–2025. Full 11-year historical data available below ↓

White students down 7 points in Whatcom County private schools, from 71% in 2020 to 64% in 2025.
# Hawaiian Students
5 Students
651 Students
% Hawaiian Students
<1%
1%
# Others Students
1,336 Students
37,123 Students
% of Others Students
27%
32%

Showing 2016–2025. Full 11-year historical data available below ↓

All Ethnic Groups

Extracurriculars and Sports:

Average Number of Extracurriculars
3 extracurriculars
8 extracurriculars
Average Number of Sports
5 sports
6 sports

Frequently Asked Questions

What are the top ranked private schools in Whatcom County, WA?
The top ranked private schools in Whatcom County, WA include Lynden Christian School, Bellingham Christian School, and Assumption Catholic School.
How many private schools are located in Whatcom County?
22 private schools are located in Whatcom County.
How diverse are private schools in Whatcom County?
Whatcom County private schools are approximately 13% minority students, which is lower than the Washington private school average of 32%.
What percentage of students in Whatcom County go to private school?
15% of all K-12 students in Whatcom County are educated in private schools (compared to the WA state average of 10%).
What percentage of private schools are religiously affiliated in Whatcom County?
45% of private schools in Whatcom County are religiously affiliated (most commonly Christian and Catholic).
Which private schools in Whatcom County are often viewed compared to one another?

Recent Articles

When a Private School Changes Head of School
A private school leadership change can raise important questions. Learn how to evaluate head of school transitions, identify warning signs, and protect your child's educational experience before enrolling confidently.
Private School Financial Aid Renewal: Could Awards Shrink?
Could your private school financial aid shrink next year? Learn why awards change, how income and school budgets affect renewal, and what parents can do to protect affordability long-term.
Need-Blind vs. Need-Aware Private School Admissions
Understand how need-blind and need-aware private school admissions affect acceptance decisions, financial aid eligibility, and affordability, with practical guidance to help parents compare schools, ask questions, and plan confidently ahead.

Filter Schools

School Level
Must Offer Grade
Show more
Gender
School Focus
Religious Affiliation
ADD/ADHD Support
Summer Program

Quick Links