Santa Barbara County Private Schools

For the 2026-27 school year, there are 37 private schools serving 5,911 students in Santa Barbara County, CA (there are 126 public schools, serving 66,698 public students). 8% of all K-12 students are educated in private schools (compared to the CA state average of 10%).
The average tuition cost is $32,821, which is higher than the California private school average tuition cost of $17,625.
50% of private schools in Santa Barbara County, CA are religiously affiliated (most commonly Catholic and Christian).

Quick Facts (26-27)

  • # Private Schools: 37
  • # Students Served: 5,911
  • Average Tuition: $32,821
  • % Students on Financial Aid: 38%
  • Acceptance Rate: 61%
  • Average Class Size: 14 students
  • % Students of Color: 40%
  • View Santa Barbara County, CA School Trends
Quick Facts (26-27)

  • # Private Schools: 37
  • # Students Served: 5,911
  • Average Tuition: $32,821
  • % Students on Financial Aid: 38%
  • Acceptance Rate: 61%
  • Average Class Size: 14 students
  • % Students of Color: 40%
  • View Santa Barbara County, CA School Trends
Top Ranked Santa Barbara County Private Schools (2026-27)

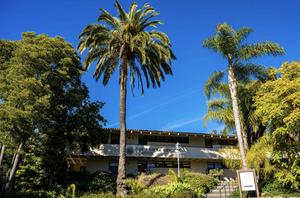
Dunn School Photo
Gr: 6-12 | 256 students
Avg. class size: 10 students
Sports: 13 | Extracurriculars: 12
2555 West Highway 154
Los Olivos, CA 93441
(805) 688-6471
(5)
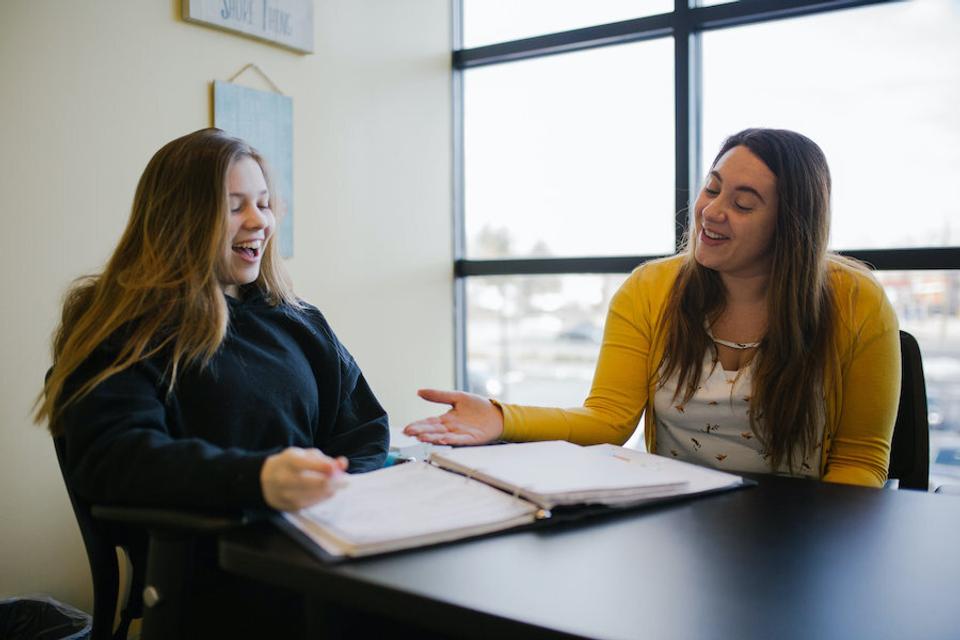
Fusion Academy Santa Barbara Photo
Gr: 6-12
Avg. class size: 1 student
Alternative School
510 State Street, 2nd Floor
Santa Barbara, CA 93101
(877) 673-8893
Bishop Garcia Diego High School Photo
Gr: 9-12
Avg. class size: 16 students
Sports: 13 | Extracurriculars: 10
Catholic
4000 La Colina Rd
Santa Barbara, CA 93110
(805) 967-1266
(40)
Cate School Photo
Gr: 9-12 | 299 students
Avg. class size: 10 students
Sports: 18 | Extracurriculars: 37
1960 Cate Mesa Road
Carpinteria, CA 93013
(805) 684-4127
Children's Montessori School Photo
Gr: PK-6 | 19 students
Avg. class size: 10 students
Extracurriculars: 1
Montessori School
1000 W. Ocean Ave.
Lompoc, CA 93436
(805) 757-6263
(2)
Crane Country Day School Photo
Gr: K-8 | 260 students
Avg. class size: 20 students
Sports: 4 | Extracurriculars: 11
1795 San Leandro Lane
Santa Barbara, CA 93108
(805) 969-7732
(1)
The Family School Photo
Gr: PK-5 | 93 students
Avg. class size: 10 students
5300 Figueroa Mountain Road
Los Olivos, CA 93441
(805) 688-5440
The Howard School Photo
Gr: PK-8 | 112 students
Avg. class size: 10 students
5315 Foothill Rd
Carpinteria, CA 93013
(805) 745-8448
(2)
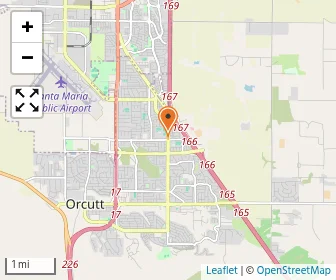
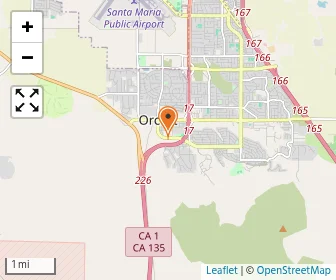
Map of The Knox School Of Santa Barbara
Gr: K-8 | 33 students
Avg. class size: 9 students
Extracurriculars: 6
Specialized Curriculum
1525 Santa Barbara St
Santa Barbara, CA 93101
(805) 222-0107
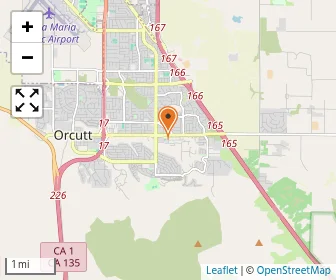
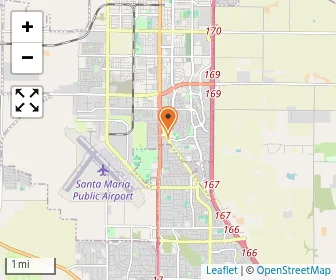
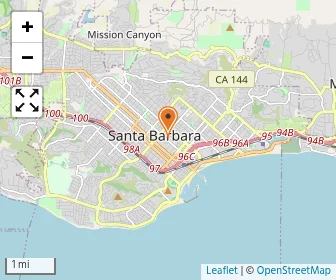
Map of La Purisima Concepcion School
Gr: PK-8 | 173 students
Catholic
219 W Olive Ave
Lompoc, CA 93436
(805) 736-6210
Laguna Blanca School Photo
Gr: PK-12 | 449 students
Avg. class size: 12 students
Sports: 11
4125 Paloma Dr
Santa Barbara, CA 93110
(805) 687-2461
Midland School Photo
Gr: 9-12 | 72 students
Avg. class size: 10 students
Sports: 7 | Extracurriculars: 10
5100 Figueroa Mountain Rd
Los Olivos, CA 93441
(805) 686-2469
Our Lady Of Mount Carmel School Photo
Gr: PK-8 | 188 students
Sports: 4
Catholic
530 Hot Springs Rd
Santa Barbara, CA 93108
(805) 969-5965
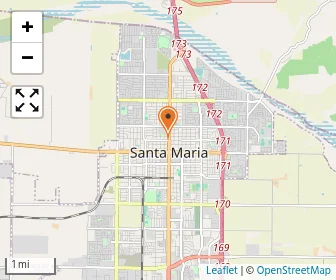
Map of Pacific Christian School
Gr: K-6 | 314 students
Avg. class size: 25 students
Assembly of God
3435 Santa Maria Way
Santa Maria, CA 93455
(805) 934-1253
Map of Providence School
Gr: NS-12 | 379 students
Avg. class size: 16 students
Sports: 7 | Extracurriculars: 5
Christian
3225 Calle Pinon
Santa Barbara, CA 93105
(805) 962-3091
The Riviera Ridge School Photo
Gr: PK-8 | 243 students
Avg. class size: 24 students
Sports: 7 | Extracurriculars: 3
2130 Mission Ridge Road
Santa Barbara, CA 93103
(805) 569-1811
(1)
Map of St. Joseph High School
Gr: 9-12 | 488 students
Catholic
4120 S Bradley Rd
Santa Maria, CA 93455
(805) 937-2038
Map of St. Louis De Montfort
Gr: K-8 | 300 students
Catholic
5095 Harp Rd
Santa Maria, CA 93455
(805) 937-5571
(1)
St. Mary Of Assumption School Photo
Gr: PK-8 | 228 students
Sports: 2
Catholic
424 E. Cypress Street
Santa Maria, CA 93454
(805) 925-6713
St. Raphael Elementary School Photo
Gr: PK-8 | 283 students
Avg. class size: 26 students
Catholic
160 Saint Josephs St
Santa Barbara, CA 93111
(805) 967-2115
Santa Barbara Middle School Photo
Gr: 6-9 | 181 students
Avg. class size: 18 students
Sports: 23 | Extracurriculars: 21
Alternative School
1321 Alameda Padre Serra
Santa Barbara, CA 93103
(805) 682-2989
(14)
Map of Valley Christian Academy
Gr: K-12 | 388 students
Avg. class size: 20 students
Sports: 5 | Extracurriculars: 3
Baptist
2970 Santa Maria Way
Santa Maria, CA 93455
(805) 937-6317
Map of Agape School Of Christian Education
Gr: 3-11 | 6 students
Christian
109 W Fesler St
Santa Maria, CA 93458
(180) 587-8872
Map of Anacapa School
Gr: 7-12 | 52 students
Avg. class size: 12 students
Sports: 5
814 Santa Barbara St
Santa Barbara, CA 93101
(805) 252-3825
Map of Cachuma Continuation And Middle School
Gr: PK-8 | 8 students
4500 Highway 154
Santa Barbara, CA 93105
(805) 701-4036
Map of Coast Hills Baptist School
Gr: 4-12 | 11 students
Baptist
650 W Rice Ranch Road
Santa Maria, CA 93455
(805) 937-7291
Coastline Christian Academy Photo
Gr: K-8 | 142 students
Avg. class size: 18 students
Sports: 1
Christian
5950 Cathedral Oaks Rd
Goleta, CA 93117
(805) 967-5834
Map of Eureka School Of Santa Barbara
Gr: 10-12 | 7 students
3324 State St Ste M
Santa Barbara, CA 93105
(805) 687-9031
Map of First Presbyterian Church Early Childhood Center
Gr: NS-PK | 68 students
Avg. class size: 8 students
Extracurriculars: 1
Daycare / Preschool (Presbyterian)
21 E. Constance Ave
Santa Barbara, CA 93105
(805) 687-6362
Grace Christian Academy Photo
Gr: K-12 | 6 students
Avg. class size: 10 students
Pentecostal
816 N C St
Lompoc, CA 93436
(805) 736-9826
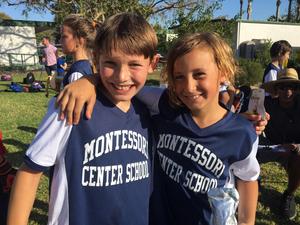
Montessori Center School Photo
Gr: PK-6 | 263 students
Avg. class size: 20 students
Sports: 5 | Extracurriculars: 11
Montessori School
401 N Fairview Ave # 1
Goleta, CA 93117
(805) 693-9383
Notre Dame School Photo
Gr: PK-8 | 115 students
Catholic
33 E Micheltorena St
Santa Barbara, CA 93101
(805) 965-1033
Map of St. Therese Classical Academy
Gr: 5-12 | 20 students
Catholic
33 E Micheltorena St
Santa Barbara, CA 93101
(805) 683-1111
Map of Santa Ynez Valley Christian Academy
Gr: PK-8 | 178 students
Avg. class size: 17 students
Sports: 4 | Extracurriculars: 1
Christian
891 North Refugio Road
Santa Ynez, CA 93460
(805) 688-3830
South Coast Montessori Photo
Gr: PK-K | 92 students
Avg. class size: 12 students
Montessori School
7421 Mirano Dr
Goleta, CA 93117
(805) 845-6555
(3)
Show 2 more private schools in Santa Barbara County, CA (out of 37 total schools)
Loading...
[+] Show Closed Private Schools in Santa Barbara County, California

Santa Barbara County Private Schools (Closed)

Map of Children's House Montessori School
Gr: PK-K | 28 students
Avg. class size: 12 students
Montessori School
1331 East Foster Rd
Santa Maria, CA 93455
(805) 937-0991
Map of Christian Life School
Gr: K-6 | 95 students
Pentecostal
709 N Curryer St
Santa Maria, CA 93458
(805) 928-3713
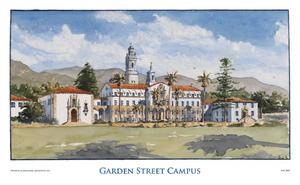
Garden Street Academy Photo
Gr: K-12 | 137 students
Avg. class size: 11 students
2300 Garden Street
Santa Barbara, CA 93105
(805) 687-3717

Overview

Category
This State (CA)
US
# Schools
38 Schools

Showing 2016–2025. Full 11-year historical data available below ↓

Private schools down 2 in Santa Barbara County, from 40 in 2024 to 38 in 2025.
# Students
5,911 Students
659,615 Students

Showing 2016–2025. Full 11-year historical data available below ↓

Average students up 6 in Santa Barbara County private schools, from 161 in 2016 to 167 in 2025, while California rose to 180 and the U.S. to 179.
% Average Students of Color
40%
52%

Showing 2016–2025. Full 11-year historical data available below ↓

Students of color up 7 points in Santa Barbara County private schools, rising from 33% in 2016 to 40% in 2025.

Academics and Faculty:

# Teachers
634 Teachers
55,836 Teachers
Average Student-Teacher Ratio
10:1
12:1

Showing 2016–2025. Full 11-year historical data available below ↓

Student-teacher ratio lower in Santa Barbara County, falling from 10:1 in 2016 to 10:1 in 2025 and reaching 9:1 in most years since 2017.
% Average Faculty w/Advanced Degree
60%
60%

Showing 2016–2025. Full 11-year historical data available below ↓

Faculty advanced degrees held high in Santa Barbara County private schools, staying near 59% in 2025 and above the U.S. rate of 55%.
Average Class Size
14 students
17 students

Showing 2016–2025. Full 11-year historical data available below ↓

Average Number of AP Courses
11 courses
15 courses
AP courses down 10 in Santa Barbara County private schools, from 20 in 2015 to 10 in 2025, while California rose from 11 to 15.
Average SAT score
1333
(Out of 1600)
1267
Average ACT score
29
(Out of 36)
28

Tuition and Acceptance Rate:

Average Yearly Tuition Cost
$32,821
$17,625

Showing 2016–2025. Full 11-year historical data available below ↓

Tuition rose $10,614 in Santa Barbara County, from $20,312 in 2016 to $30,926 in 2025.
Average Summer Program Cost
$8,500
$1,072
Average % on Financial Aid
38%
29%

Showing 2016–2025. Full 11-year historical data available below ↓

Financial aid up 8 points in Santa Barbara County private schools, from 31% in 2016 to 39% in 2025.
Average Financial Aid Grant
$20,602
$9,632

Showing 2016–2025. Full 11-year historical data available below ↓

Grant amount still high private-school aid in Santa Barbara County was $19,973 in 2025, well above California's $8,932 and the U.S. $7,073.
Average Acceptance Rate
61%
83%

Showing 2016–2025. Full 11-year historical data available below ↓

Average Endowment Size
$19 million
$18.27 million

Students by Ethnicity:

0.68
0.74

Showing 2016–2025. Full 11-year historical data available below ↓

Diversity score up 5 points in Santa Barbara County private schools, rising from 0.63 in 2016 to 0.68 in 2025.
# American Indian Students
34 Students
3,574 Students
% American Indian Students
1%
1%

Showing 2016–2025. Full 11-year historical data available below ↓

# Asian Students
291 Students
71,777 Students
% Asian Students
5%
11%

Showing 2016–2025. Full 11-year historical data available below ↓

Asian share flat at 5% in Santa Barbara County private schools in 2025, down from 6% in 2016 while California stayed at 11%.
# Hispanic Students
1,269 Students
104,405 Students
% Hispanic Students
22%
16%

Showing 2016–2025. Full 11-year historical data available below ↓

Hispanic share up 4 points in Santa Barbara County private schools, from 18% in 2016 to 22% in 2025.
# Black Students
134 Students
30,221 Students
% Black Students
2%
5%

Showing 2016–2025. Full 11-year historical data available below ↓

# White Students
2,811 Students
235,730 Students
% White Students
48%
37%

Showing 2016–2025. Full 11-year historical data available below ↓

White share down 6 points in Santa Barbara County private schools, from 55% in 2016 to 49% in 2025.
# Hawaiian Students
31 Students
5,499 Students
% Hawaiian Students
1%
1%
# Others Students
1,247 Students
188,740 Students
% of Others Students
21%
29%

Showing 2016–2025. Full 11-year historical data available below ↓

Other-race share up 2 points in Santa Barbara County private schools, from 18% in 2016 to 20% in 2025.
All Ethnic Groups

Extracurriculars and Sports:

Average Number of Extracurriculars
9 extracurriculars
9 extracurriculars
Average Number of Sports
8 sports
7 sports

Frequently Asked Questions

What are the top ranked private schools in Santa Barbara County, CA?
The top ranked private schools in Santa Barbara County, CA include Cate School, The Knox School Of Santa Barbara, and Crane Country Day School.
How many private schools are located in Santa Barbara County?
37 private schools are located in Santa Barbara County.
How much do private schools cost in Santa Barbara County?
The average tuition cost is $32,821, which is higher than the California private school average tuition cost of $17,625.
How diverse are private schools in Santa Barbara County?
Santa Barbara County private schools are approximately 40% minority students, which is lower than the California private school average of 52%.
What percentage of students in Santa Barbara County go to private school?
8% of all K-12 students in Santa Barbara County are educated in private schools (compared to the CA state average of 10%).
What percentage of private schools are religiously affiliated in Santa Barbara County?
50% of private schools in Santa Barbara County are religiously affiliated (most commonly Catholic and Christian).
Which private schools in Santa Barbara County are often viewed compared to one another?

Recent Articles

When a Private School Changes Head of School
A private school leadership change can raise important questions. Learn how to evaluate head of school transitions, identify warning signs, and protect your child's educational experience before enrolling confidently.
Private School Financial Aid Renewal: Could Awards Shrink?
Could your private school financial aid shrink next year? Learn why awards change, how income and school budgets affect renewal, and what parents can do to protect affordability long-term.
Need-Blind vs. Need-Aware Private School Admissions
Understand how need-blind and need-aware private school admissions affect acceptance decisions, financial aid eligibility, and affordability, with practical guidance to help parents compare schools, ask questions, and plan confidently ahead.

Filter Schools

School Level
Must Offer Grade
Show more
Gender
School Focus
Religious Affiliation
ADD/ADHD Support
Summer Program

Quick Links